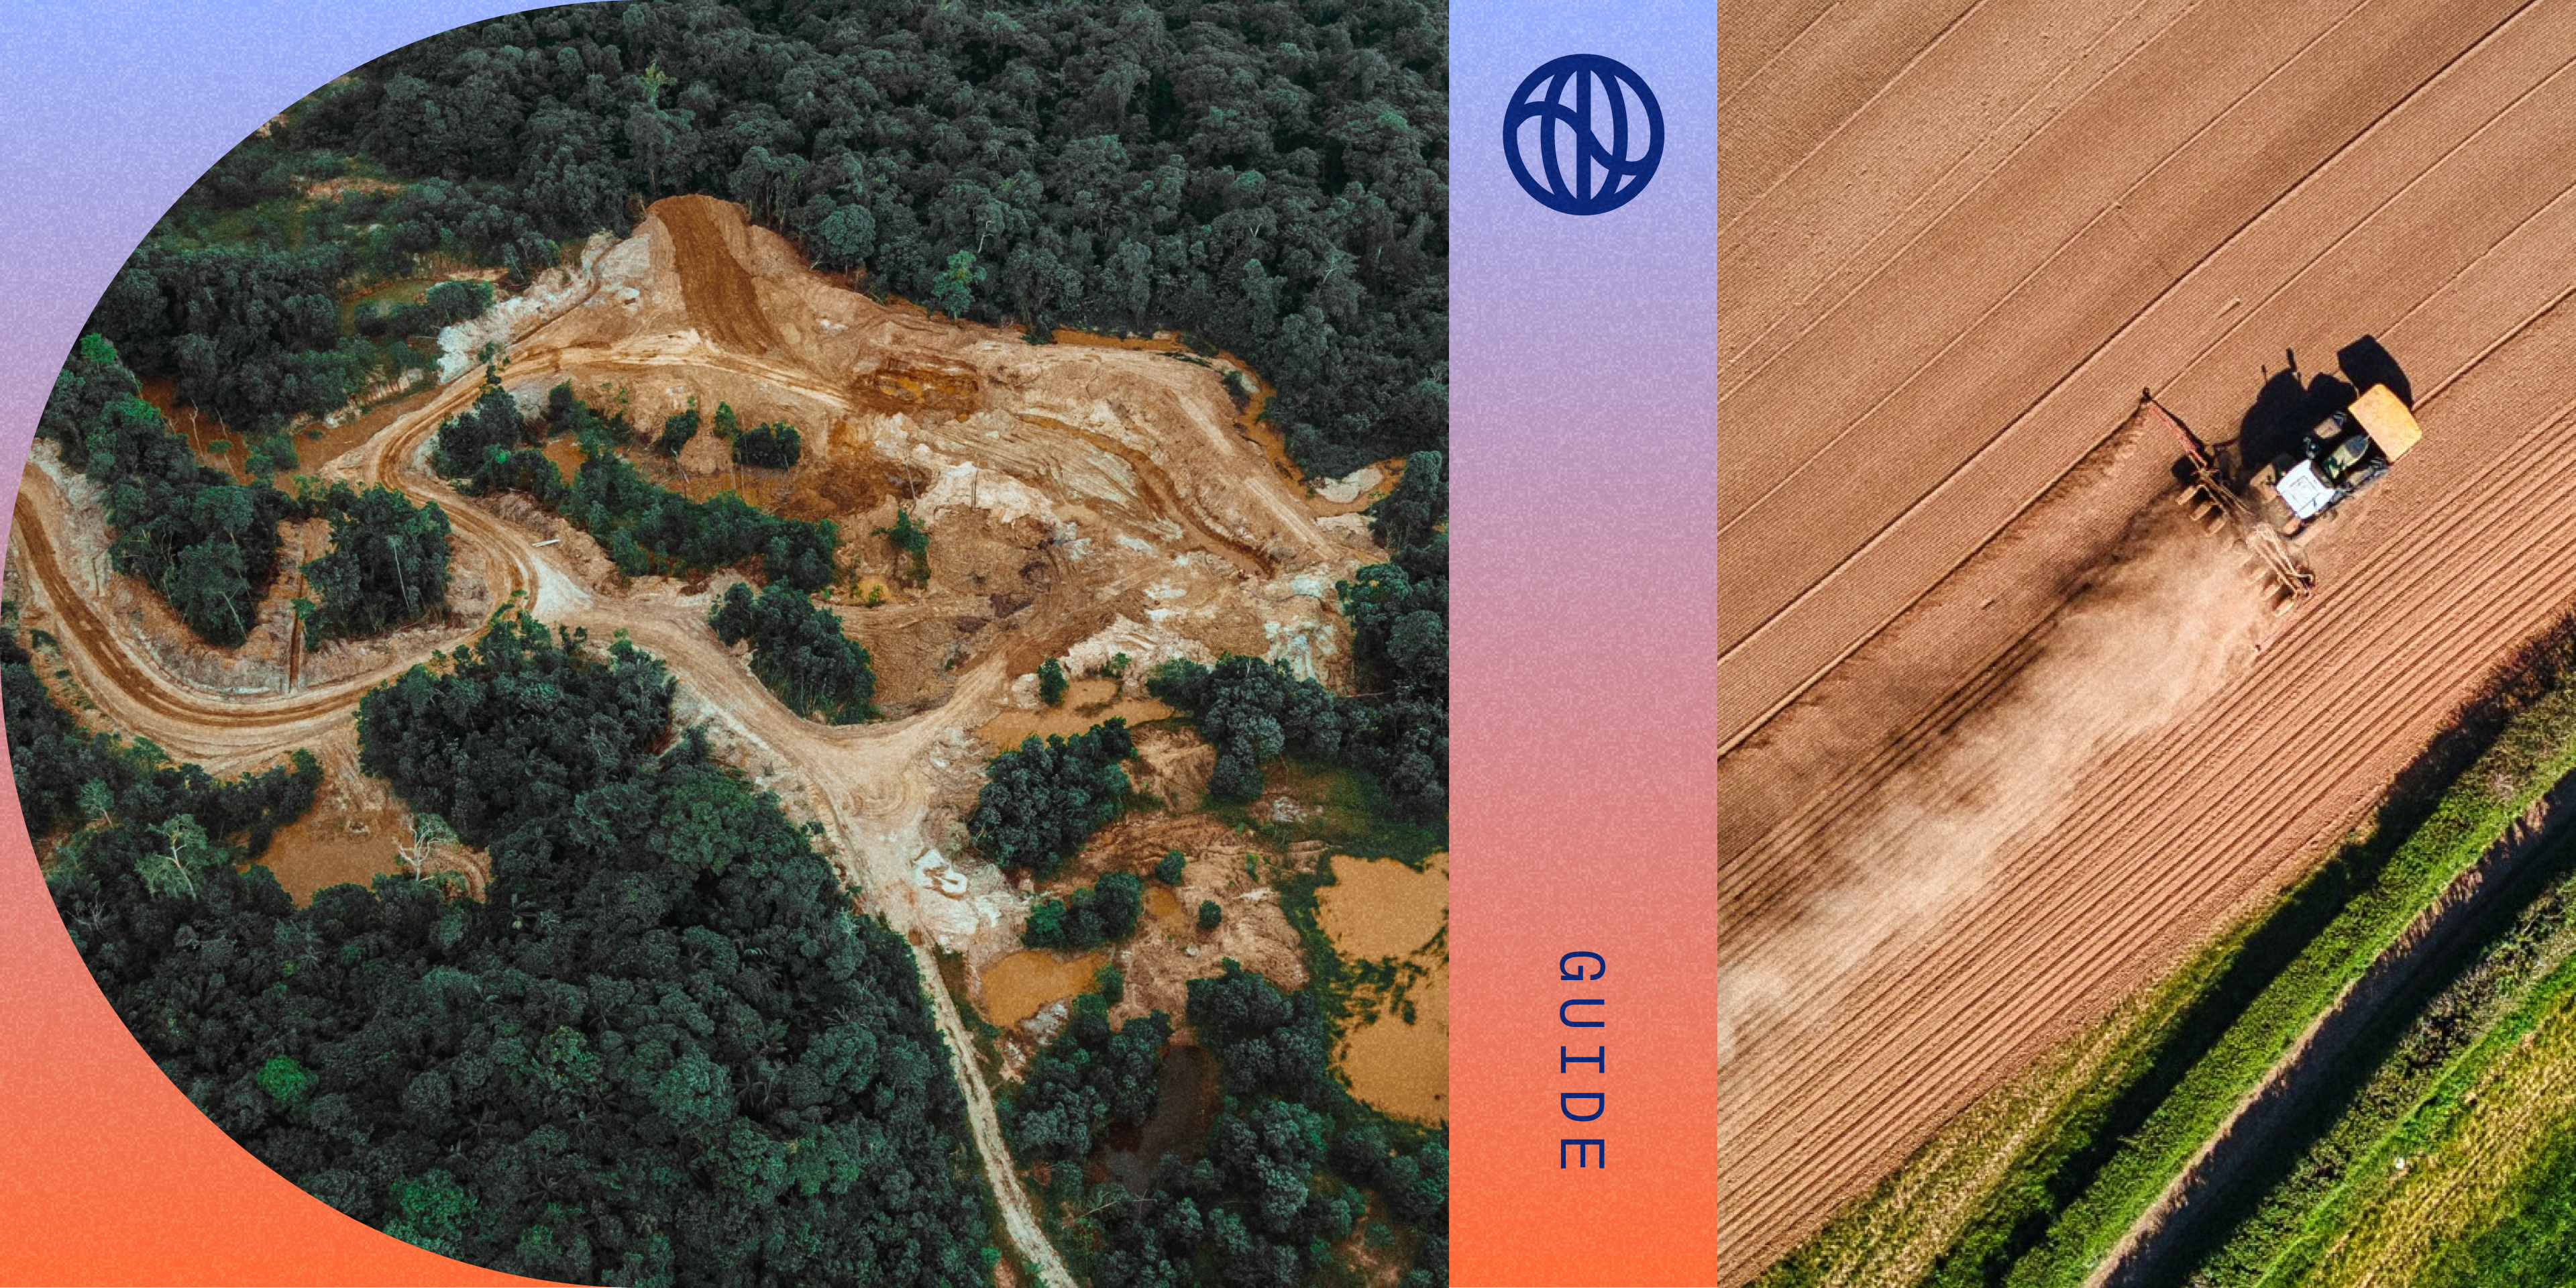
Burning fossil fuels is not the only way that corporate activity contributes to climate change; almost a quarter of global emissions come from land-related emissions that are unrelated to fuel usage.
These emissions can come from activities such as deforestation, which releases large amounts of stored carbon, or livestock management, which releases methane, a potent greenhouse gas.
FLAG (Forest, Land, and Agriculture) emissions are a category of greenhouse gas emissions that encompass the many ways land use change and land-related activities impact the climate.
Measuring FLAG emissions is key to developing a more comprehensive view of an organization’s carbon footprint, and this doesn’t just apply to farmers and lumber companies—it’s critical for any business whose supply chain relies on animal, crop, or wood products. Companies in industries including food, apparel, retail, and construction all have potentially significant FLAG emissions.
It’s crucial for all companies to understand what FLAG emissions are, and how material they are to your footprint, because international climate disclosure guidance now requires certain companies to measure and disclose FLAG emissions for the first time.
FLAG emissions primarily come from two sources:
Land use change (LUC): Emissions related to a change in land use within the past 20 years. For instance, let’s say a forest was cut down 5 years ago for lumber, cattle grazing, or cotton farming; this shift gradually produces emissions over time by releasing stored carbon in the plant material, and decreasing the land’s natural ability to store carbon.
Land management (LM): Emissions from land-related activities within the reporting year. This includes activities that involve fertilizer and manure usage, livestock management, and forest degradation.
For companies with significant FLAG emissions, measuring this component of your footprint is necessary for you to plan and implement effective decarbonization strategies for your business.
Why is FLAG important now?
The Greenhouse Gas Protocol (GHGP)—the main standard-setting body for carbon accounting—released its draft Land Sector & Removals (LSR) Guidance earlier this year. This LSR guidance is a 300+ page document with very detailed requirements on measuring FLAG emissions. Previously, due to the lack of guidance, many companies avoided measuring FLAG emissions or had inconsistent methodology.
The draft GHGP LSR Guidance asks the following:
- Companies with agriculture, forest, or land-based activities in their value chain must follow the new LSR guidance for measurement.
- Companies need to separately report GHG emissions related to (1) land use change (LUC), (2) land management (LM), and (3) one of several land tracking metrics, like land occupation.
- Companies must also separately report any land-based carbon removals within their value chain, and provide primary data to back these claims.
Along with this LSR guidance, the Science Based Targets Initiative (SBTi) is mandating separate FLAG targets for all companies that are (1) in FLAG-related sectors (see next section), or (2) have FLAG emissions that are >20% of their total footprint, regardless of industry.
For companies that meet either of these criteria, SBTi is requiring companies to use the draft LSR guidance to add FLAG targets on an aggressive timeline:
- Companies that are currently in the process of setting targets must now additionally set separate FLAG targets.
- Companies with existing validated near-term SBTs must submit additional FLAG targets by EOY 2024 (or EOY 2023 if the original targets were approved prior to 2020).
- All affected companies will need to commit to “zero deforestation” targets with a target date no later than EOY 2025.
The bottom line: companies with reliance on land, agriculture, or other nature-based products—whether in their own operations or their supply chain—must begin quantifying this climate impact and making plans to reduce these emissions.
Who is impacted by new FLAG guidance?
SBTi designates FLAG-related sectors as the below:
- Food Products: Animals, Agricultural Production, Food & Beverage Processing and Retailing.
- Forest / Paper Products: Forestry, Timber, Rubber, Pulp & Paper.
- Tobacco.
While the above sectors are required to use SBTi’s FLAG guidance, there are a variety of other industries that may fall into the second criteria of having >20% FLAG emissions in their footprint:
- Apparel: Textiles Manufacturing, Spinning, Weaving.
- Restaurants.
- Retailing: Consumer Durables, Household and Personal products.
- Tire Manufacturing and Retailing.
- Containers and Packaging.
- Hotels, Leisure, and Tourism Services.
- Construction: Building Products, Home Building, and Construction Materials.
For companies in this second list of industries, we recommend measuring FLAG emissions in your Scope 3 to determine how material FLAG is to your total footprint.
For instance, if you’re an apparel company with leather purses or cotton jeans, a furniture retailer who sells wooden bed frames and tables, or a tire company that uses natural rubber, you likely need to measure FLAG emissions to get an accurate sense of your environmental impact. For some of our customers, FLAG emissions were estimated at more than half of their overall footprint.
How does Watershed measure FLAG?
Based on the new GHGP guidance, most existing emission datasets do not have the sophistication, granularity, and geographical coverage needed to be FLAG-compliant. In contrast, Watershed built our methodology from the ground up to make it simple for companies to add granular, GHGP-compliant FLAG measurement to their footprint and set FLAG SBTs.
Professor Steve Davis, Chair of Watershed’s Science Advisory Board, developed a groundbreaking, peer-reviewed method to quantify direct GHG emissions from land use change and land management for over 150 agriculture and forest commodities.
FLAG emissions are highly location-dependent—for instance, one Watershed customer found that their Brazilian-sourced beef was roughly twice as emissive as their American beef, once they accounted for the level of Amazonian deforestation caused by cattle ranching. Watershed’s dataset is customized for over 200 countries and regions based on state-of-the-art data from the UN Food and Agriculture Organization.
Watershed incorporated this FLAG methodology into our CEDA Global database, an industry-leading, multi-region emission factor dataset used by consulting and auditing companies globally. CEDA was developed by Watershed’s Head Scientist, Dr. Sangwon Suh, and covers 149 countries and regions and the complex, interconnected emissions sources that flow between the various countries and industries.
By integrating these two cutting-edge methodologies, Watershed’s FLAG methodology not only allows you to measure these emissions, but also unlocks key emission reduction insights like the following:
- Prioritize your efforts based on the specific product and country of origin, allowing you to make better sourcing decisions and develop country-specific action plans.
- Identify the underlying sources of your FLAG emissions (e.g. fertilizer, methane) across your footprint, enabling you to plan and quantify reductions actions to achieve your climate targets.
- Clearly break out your land use change and land management emissions from your energy/industry emissions across your entire Scope 3—necessary for compliance with the new GHGP and SBTi guidance.
Key takeaways
If your company has substantive agriculture, forest, or land-related activities in your value chain, you need to start thinking about FLAG measurement. To accurately measure and reduce FLAG emissions, you need country-level FLAG emissions factors to reflect the significant differences between regions and a unified calculation system that can reflect improvements in your data over time.
Watershed’s FLAG methodology is based on peer-reviewed research and provides data on 150+ commodities and 200+ countries, providing confidence that your measurement is as comprehensive as possible.


