Every platform in this category says it’s audit-ready, AI-powered, and end-to-end. Based on market research and hundreds of buyer conversations, we’ve identified nine tests to help you identify the differences across these claims: six to run live in a demo, three to email to everyone on your shortlist.
Each one gives you a number or a specific answer instead of a “yes.” Pick the five to seven that matter most to you, and run those with every vendor on the list.
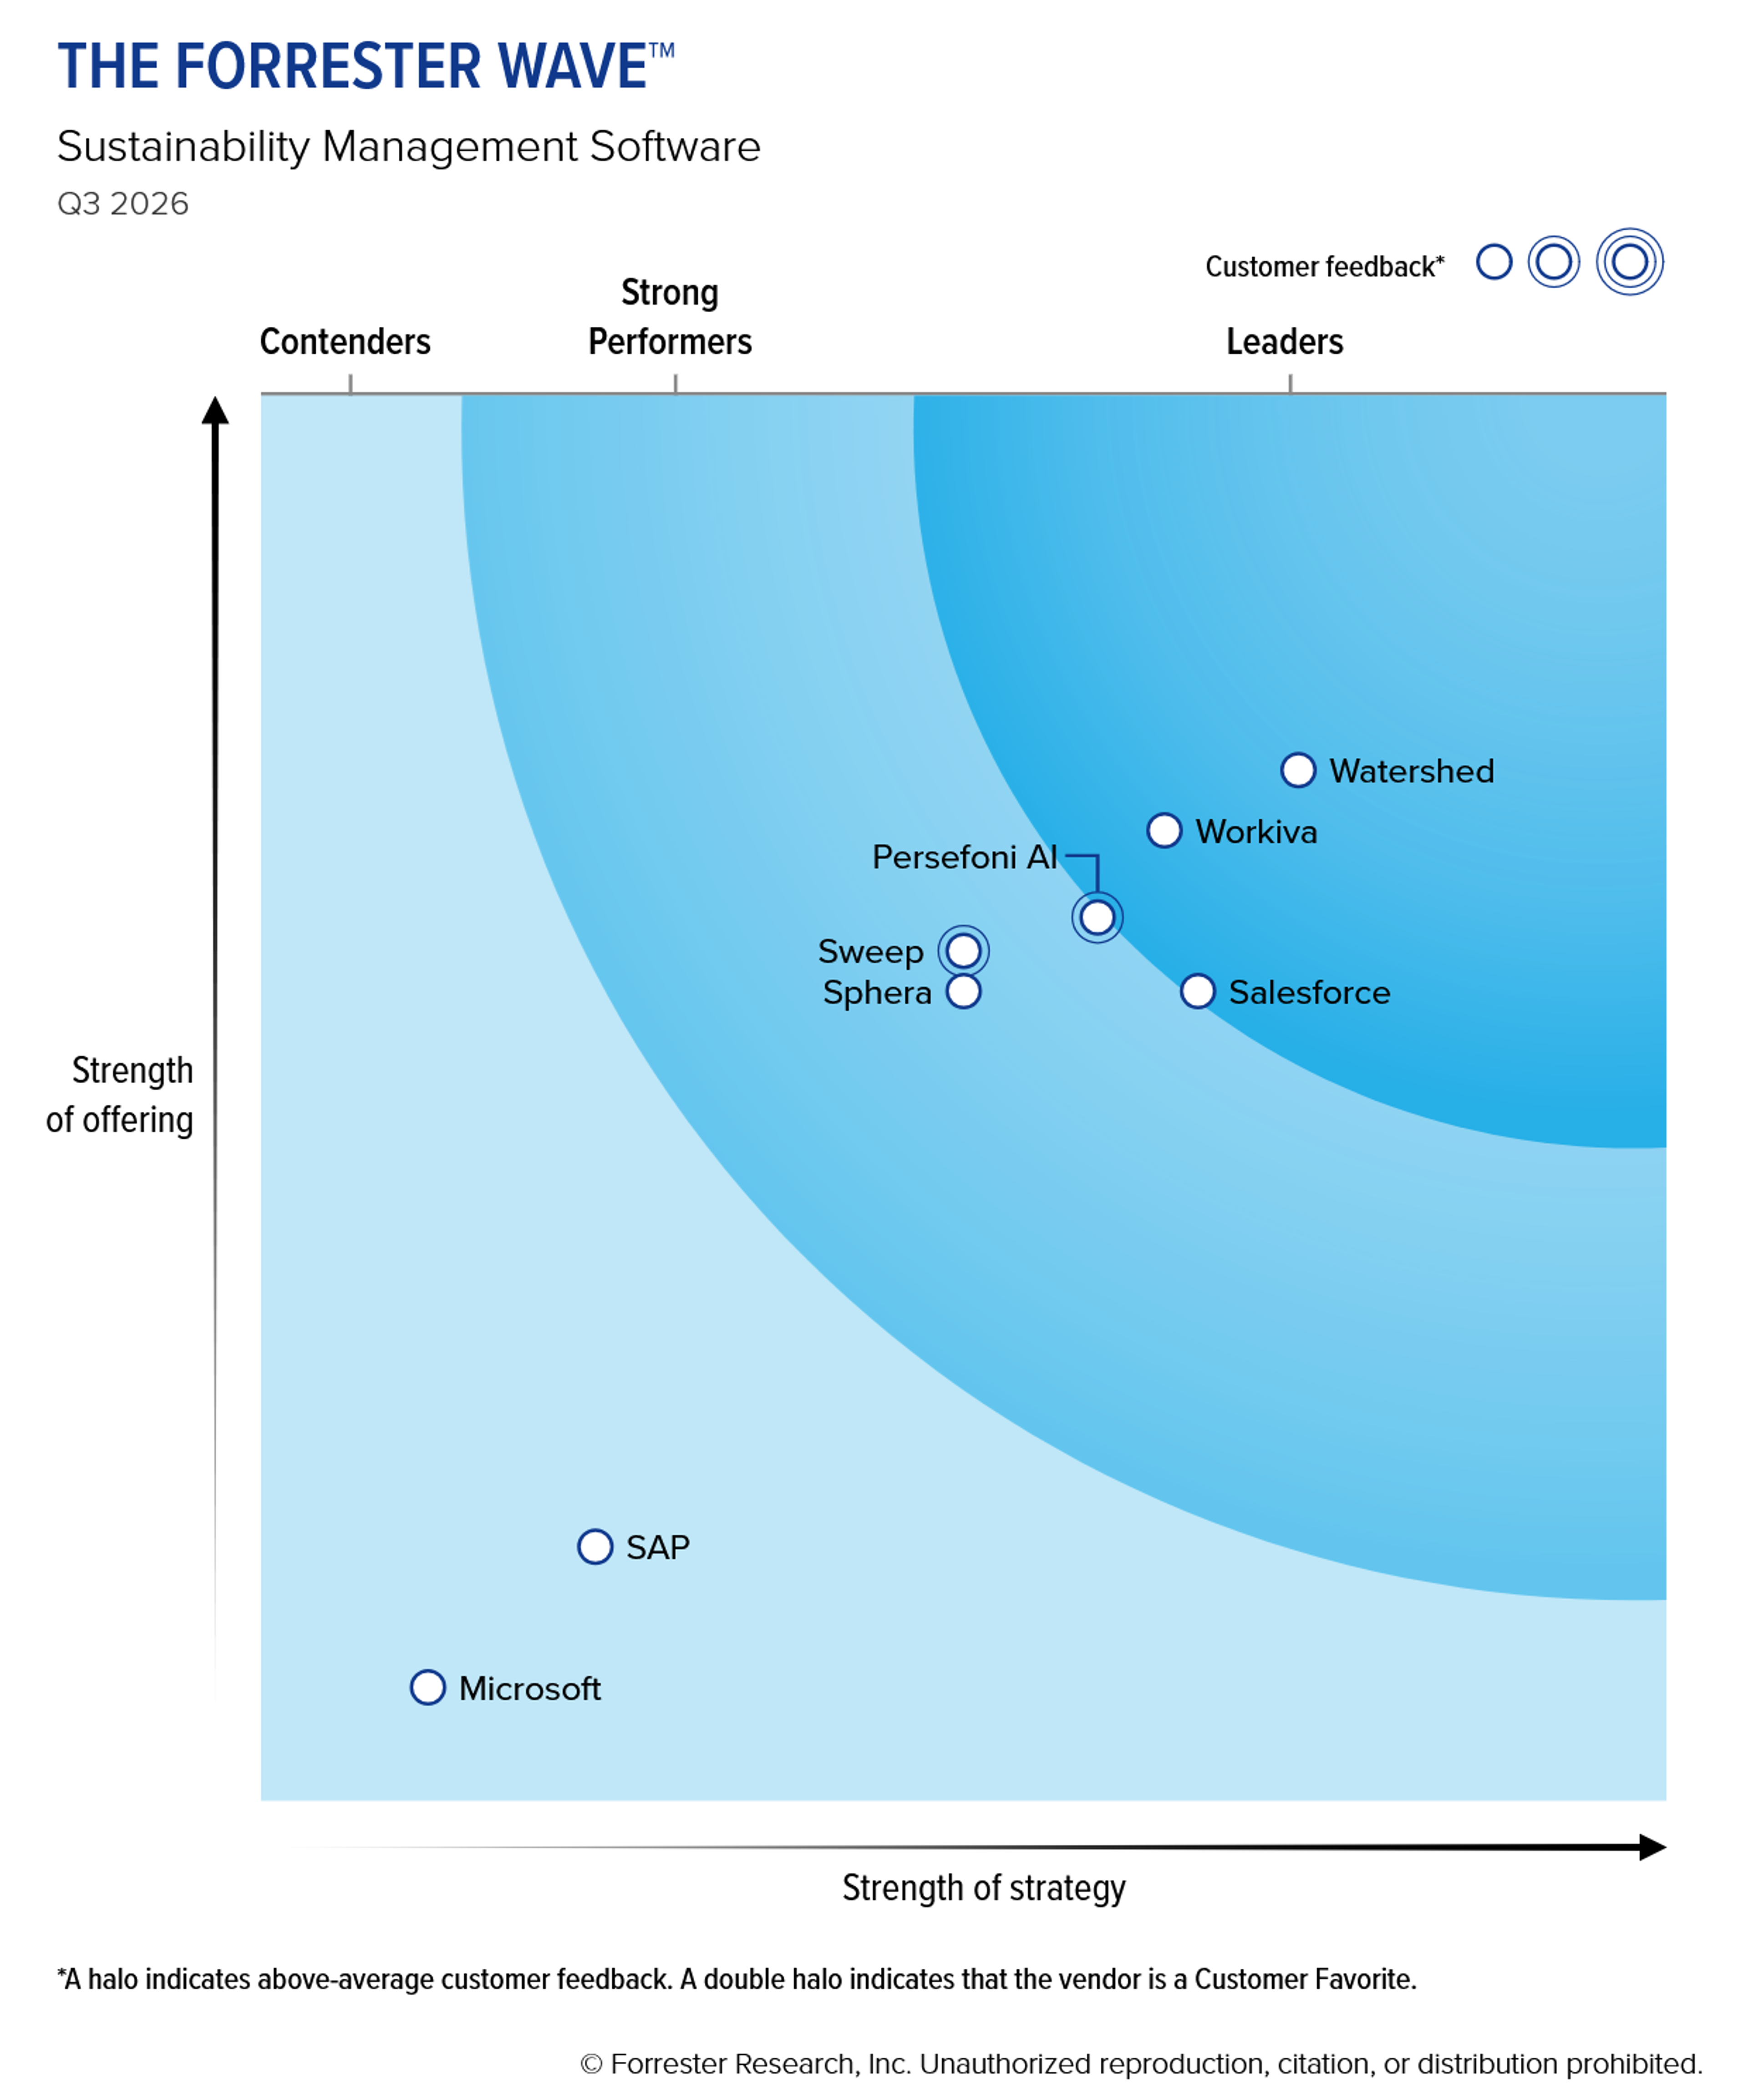
Download the full Forrester report →
Bring your own data. A file the vendor prepared shows you how the platform behaves in the best case, not in yours. Use your messiest spend export, your real products, your actual draft disclosure. Every test below assumes the vendor is seeing it for the first time.
Six tests to run live in the demo
1. Clean it
Upload a file in the state your team actually keeps it. Ask the vendor’s AI to hand it back ingestion-ready, on the call. Then ask what happens next year: can that exact transformation be saved and rerun on the next file, or does someone repeat the work?
Strong evidence. Units, currencies, and dates normalized, duplicates resolved. A PDF bill parsed into rows, in minutes, with no manual edits and every assumption clicking back to the original cell. The sequence then saves as a reusable step that runs itself on next year’s file.
Warning sign. The AI misses or can’t explain steps. Cleanup is one-off, so the same work returns with every new file across every cycle.
Why it matters. Data prep takes more of a sustainability team’s bandwidth than any other step, and it comes back every year. A platform that cleans your file gives you that time back every cycle.
2. Catch it
Introduce a simple data quality issue: remove units from a few rows, include a date outside the reporting period, or delete several months of data for one site. Does the platform flag the issue, ask for clarification, or prevent it from flowing into reporting?
Strong evidence. The issue is flagged with a clear explanation, tied to the affected site, meter, or reporting period, and routed to a reviewer. The final decision (corrected, accepted, or excluded) is recorded in the audit trail.
Warning sign. The platform only validates file format at upload, or relies on user-configured checks that catch only issues someone already thought to set up.
Why it matters. Restatements are expensive; unexplained ones are worse. The goal is to see whether incomplete, out-of-period, or questionable data gets stopped and reviewed before it affects disclosures.
3. Configure it
Ask what you have to configure before the platform returns a first measurement. Get a list of every mapping rule and methodology decision your team owns on day one, and who maintains each one after go-live. Count the number of decisions you’ll have to make.
Strong evidence. A short list. Emissions factors matched automatically against a current, country-specific library, with methodologies pre-configured to the GHG Protocol, SBTi, and FLAG. You customize by exception, and the vendor maintains the defaults.
Warning sign. A long list. Rules you build category by category before you see a number, factors selected by hand, and a maintenance column with your team’s name in every row.
Why it matters. Configuration never appears in the license price, but you pay for it twice. Everything you configure, you also maintain, document for your auditor, and rebuild when a standard changes.
4. Trace a number
Pick any figure in a finished report and ask them to trace it back to the source row. Does every transformation step (e.g., cleaning, standardization) and the emissions factor’s metadata show along the way?
Strong evidence. Reported figure, lineage overview, transformation steps, source data, with factor vintage, geography, boundary, and source database visible in-depth at each step.
Warning sign. An activity log and row-level totals, with the calculation itself still a black box.
Why it matters. You need to show how you got from an activity to an emissions number: for your assurance provider, and for yourself when a figure looks off two days before filing.
5. Compare to peers
Open a draft disclosure and ask to see how direct peers answered the same section.
Strong evidence. Benchmarking against tens of thousands of real disclosures, section by section, plus auditor-style review and alerts when upstream data goes stale before you file.
Warning sign. Industry-average emissions intensity, or a template with no comparison layer at all.
Why it matters. You’re judged against your peers, not against broad averages. Without their answers, you find out what you left out from a rating agency or an auditor.
6. Create a Product Carbon Footprint (PCF)
Give the vendor one product name. Time how long it takes to get a hotspot analysis for your supply chain, plus two sourcing scenarios, inside the platform (no spreadsheets).
Strong evidence. A first footprint in hours vs. months, an editable process tree you can adjust, and instant reruns when an assumption changes.
Warning sign. Value-chain mapping by hand, or calculations that finish offline in a spreadsheet.
Why it matters. The goal isn’t just to collect supplier data. It’s to turn whatever data you have, from rough inputs to mature supply chain intel, into faster hotspot analysis, sourcing decisions, and measurable progress toward your goals.
Three questions to ask outside the demo
Send these by email to every vendor on the shortlist.
1. Audit pass rate
What share of carbon footprints built on your platform have passed third-party assurance, and will you stand behind that contractually?
Strong evidence. A stated pass rate, references who’ve been through assurance on the platform, and the ability to get a contractual commitment behind it.
Warning sign. “Our customers pass” with no rate, no references, and nothing in writing.
Why it matters. A failed or delayed assurance isn’t an internal problem. It reaches your board, and eventually the public file.
2. Who you get after signing
How many climate scientists and policy experts are on staff as employees—not consulting partners? Who covers each region you operate in, and is their time included or billed?
Strong evidence. A named in-house team you can meet during the eval, coverage in your regions, and ongoing support included by default rather than sold by the hour / day.
Warning sign. Support that arrives as a statement of work, or a support model with no one in your time zone(s).
Why it matters. Every question the platform can’t answer becomes an invoice, and every coverage gap becomes a wait for someone to get online.
3. Who does the work when standards change?
When a standard or emissions factor set updates, who re-maps, performs quality checks, and ensures audit readiness—and do the updates flow through to measurements you’ve already made?
Strong evidence. Methodology and database updates applied on a published cadence.
Warning sign. Your team re-maps, or updates land as a migration project you scope and staff.
Why it matters. Stale factors are an audit finding waiting to happen, and manual re-mapping is work that comes back every year.
All nine tests aim to help you determine how much of the work is handled by the platform vs. by your team in configuration you’ll do later, in external spreadsheets, or with services you’ll buy in year two. Total cost of ownership is mostly that effort, priced. When budgeting, factor in not just the license cost but implementation time, ongoing internal resource requirements, and what additional emissions factor databases or tooling may be required such as last-mile reporting or PCF solutions. Ask any vendor to help you model it before you decide.