April brought exciting enhancements to Watershed’s platform across the board—from measurement to drilldown and beyond—here’s a roundup of the new capabilities that came out in the last month (plus one big one that’s coming this week).
The new Watershed API (GA May 2nd)
In two days, the new and improved Watershed API will be available to all customers. You can now establish a single external connection for all of your business data to flow into (and out of) Watershed. Reduce time spent handling data and increase measurement flexibility—measure when you want, as often as you want. Plus, get the same data governance, controls, and auditability available with .csv uploads via Watershed’s intelligent data ingestion (IDI). The cherry on top: the API will reduce your IT team’s cost of ownership by bringing the number of managed external connections down to just one.
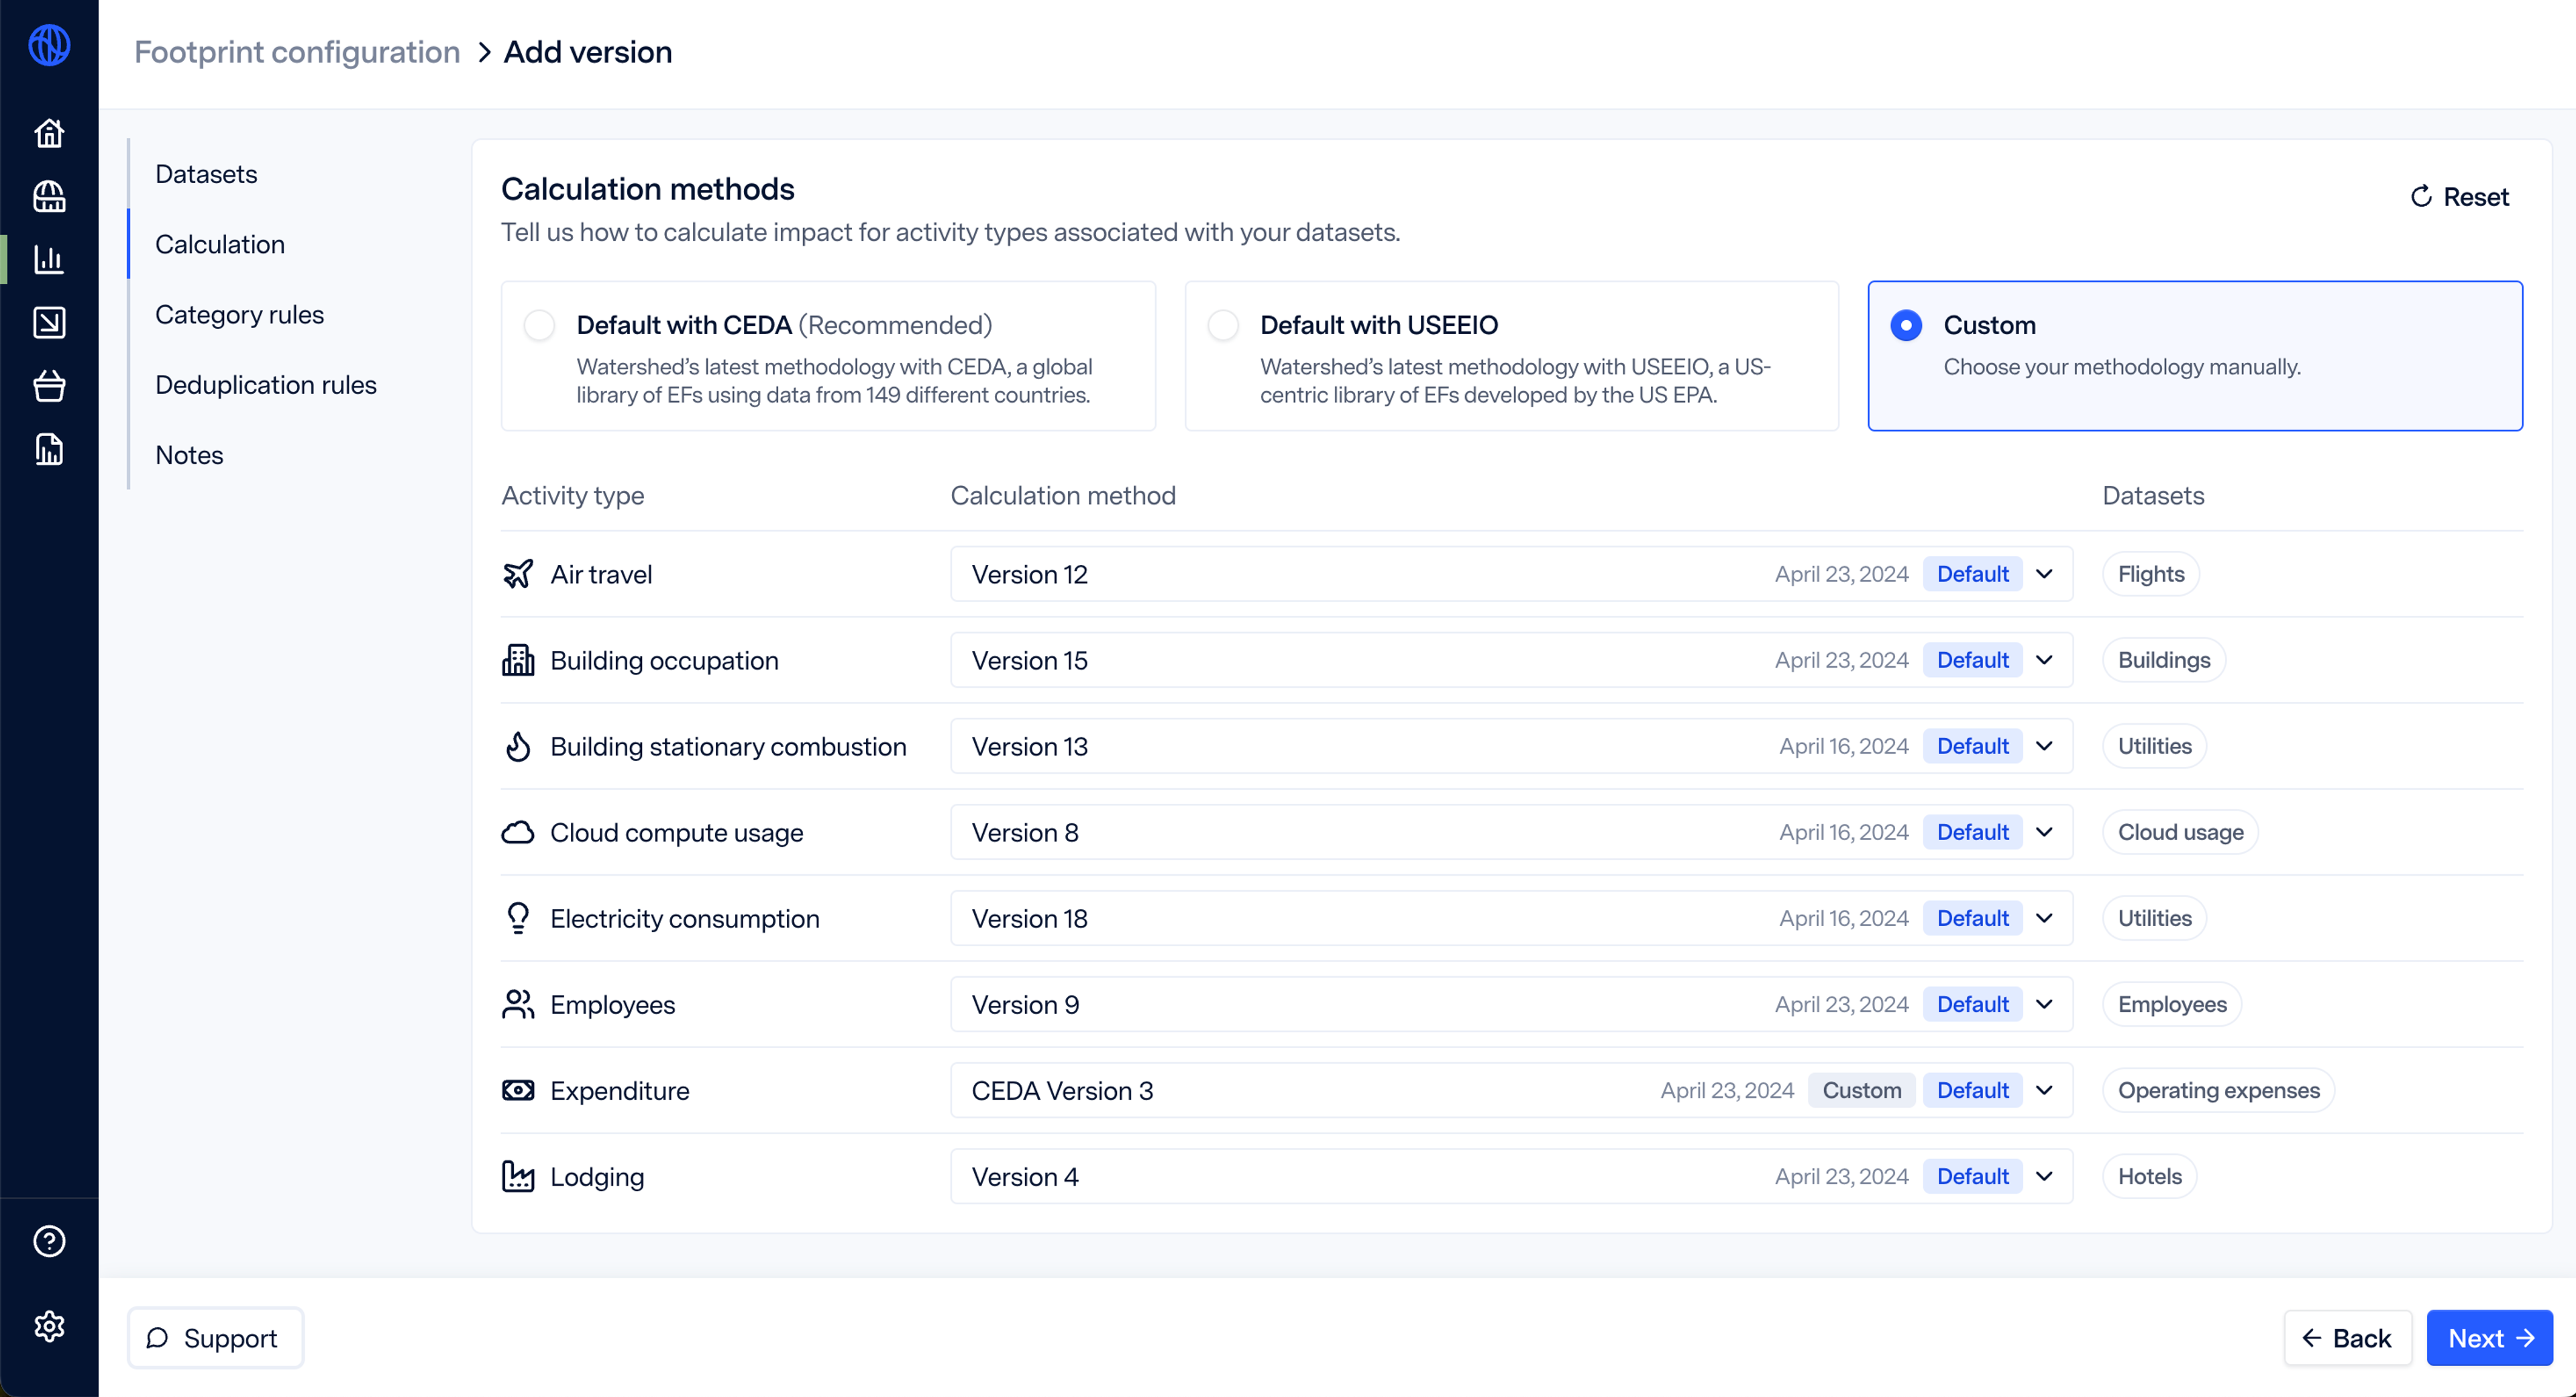
Calculation method versions
We’re giving you more control than ever when choosing the methodology for your footprint calculations. Now, you can select one of Watershed’s default options (CEDA or USEEIO), or manually choose your calculation method from previous methodology versions or custom methodology specific to your business. Watershed’s default methodologies will always contain the most up-to-date emissions factors based on the latest climate science, and previous versions will stay available for up to two years. You can now also see methodology at a footprint line item level, making it easier to discern whether fluctuations in your footprint are the result of input data or methodology changes.
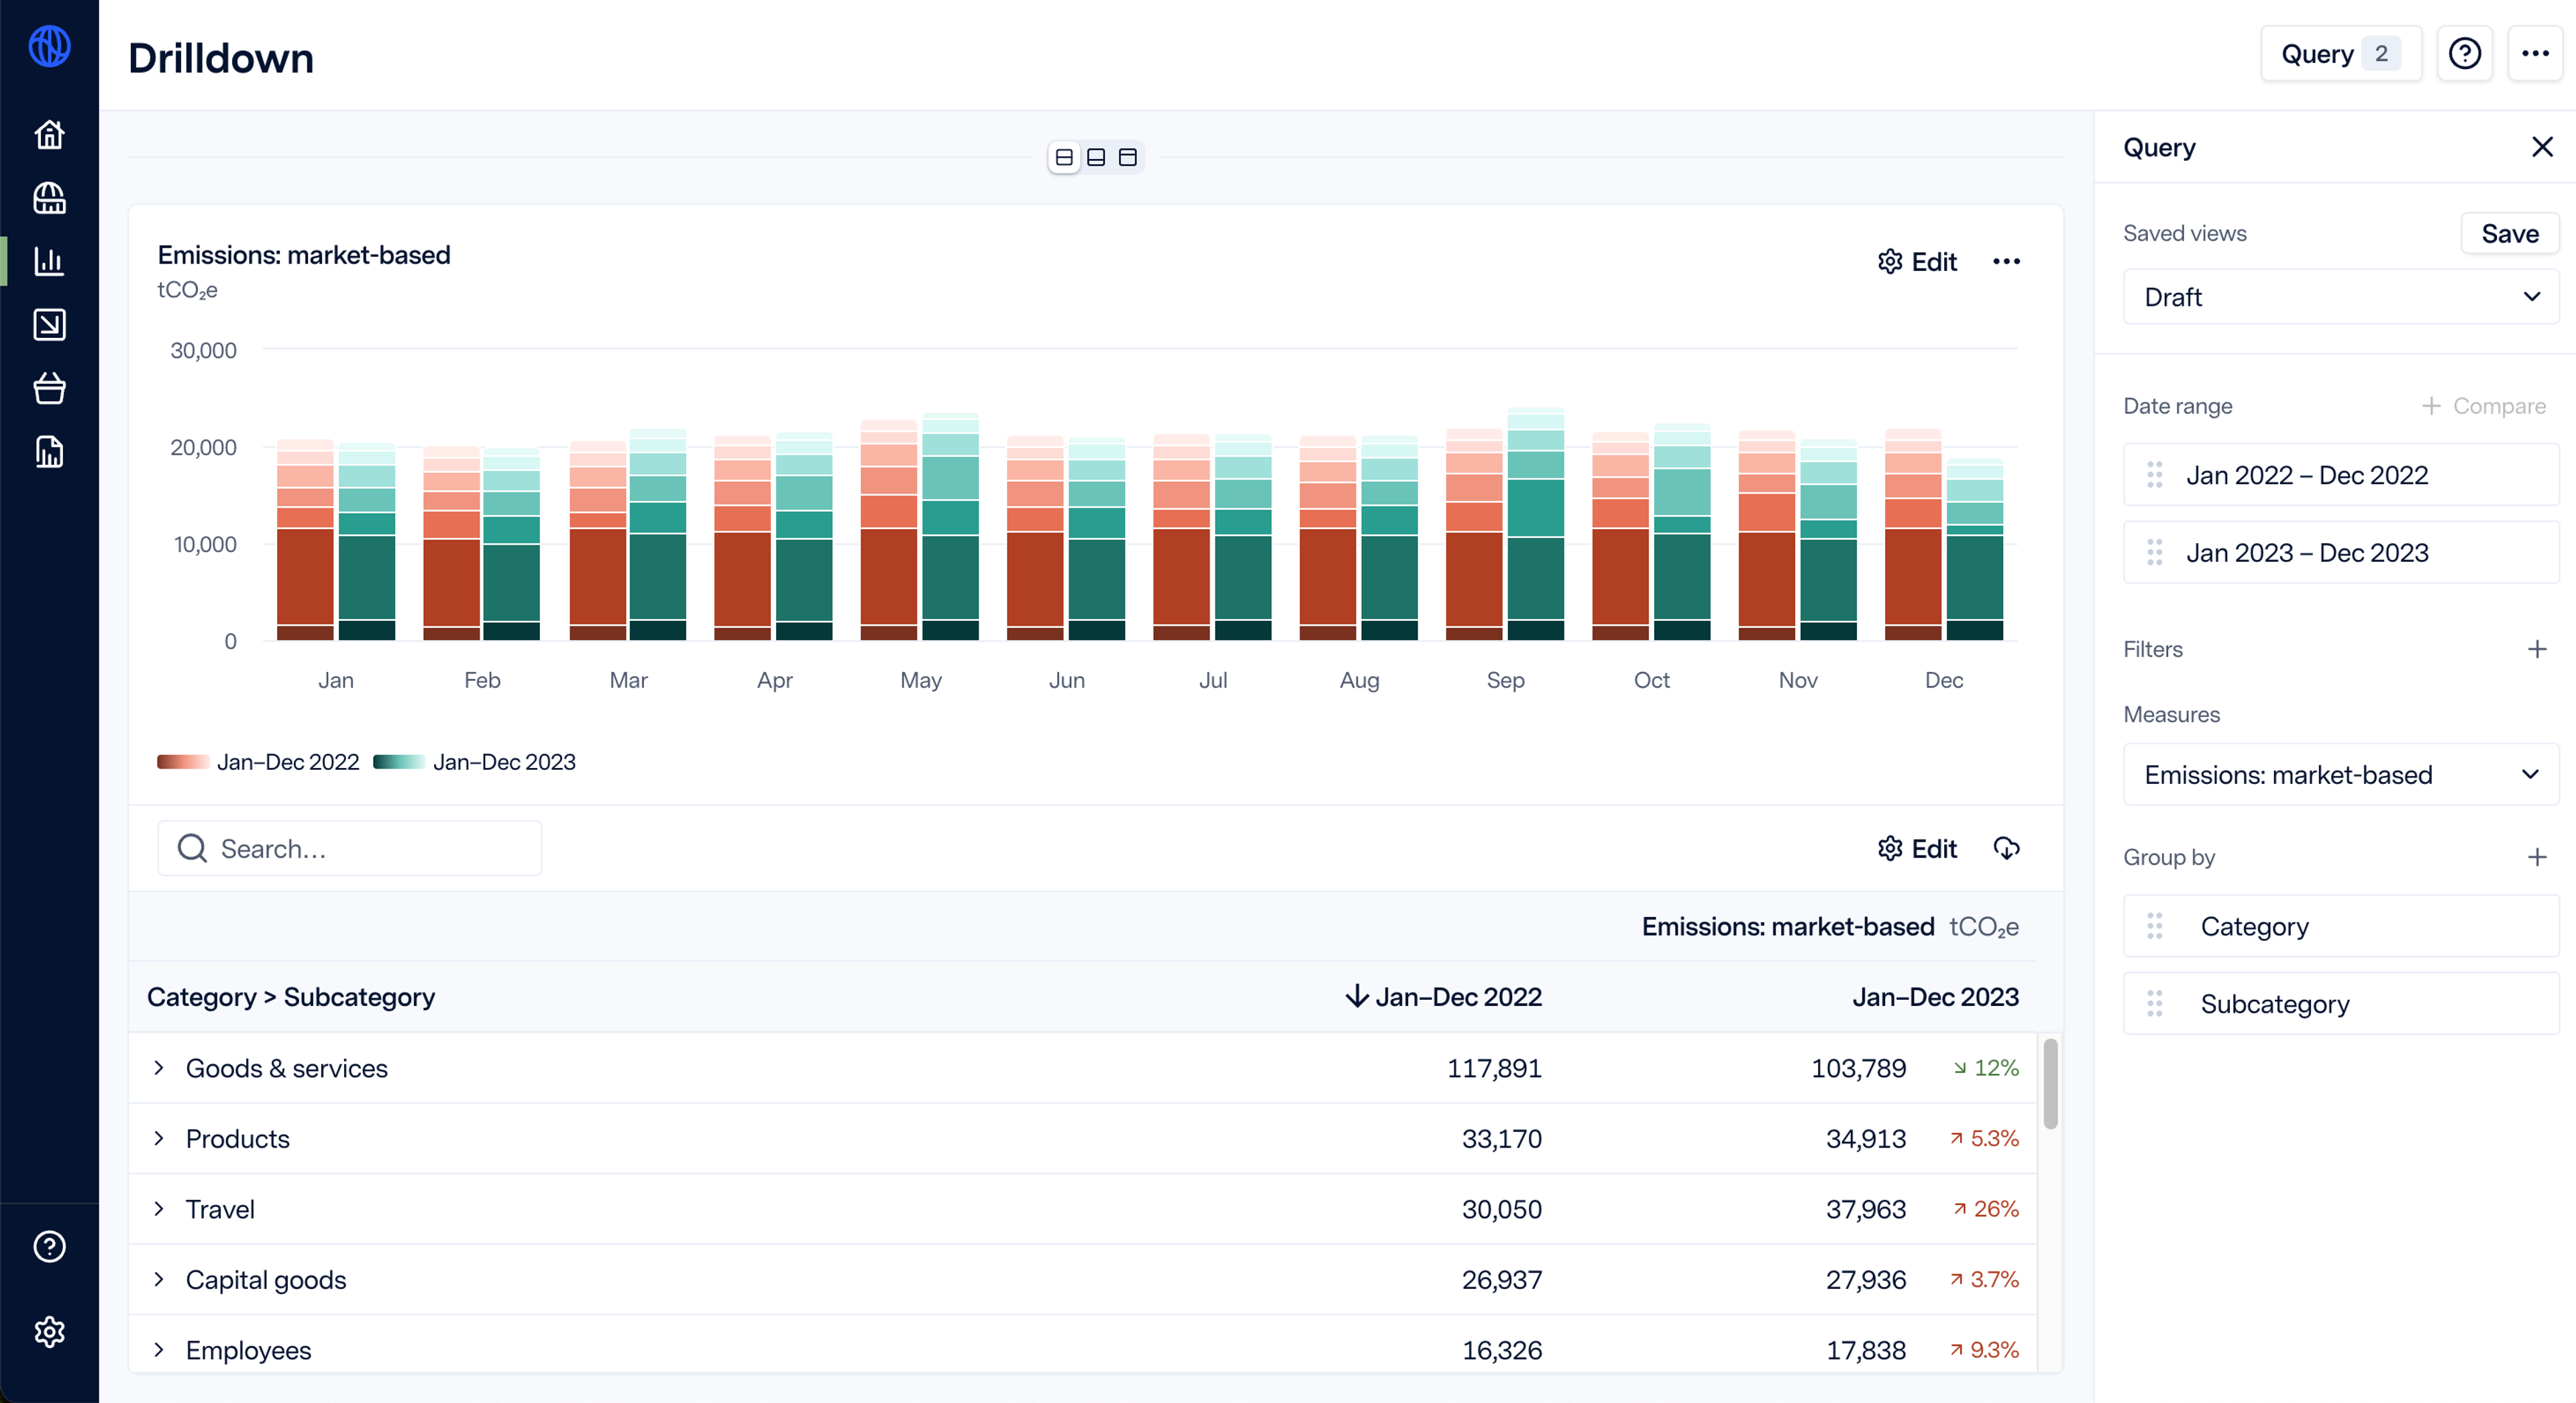
Drilldown updates
Two new drilldown features launched this month that will allow you to compare and visualize your data in new and exciting ways:
1. More flexible time comparisons
Users can now choose any time comparison window, including custom dates.
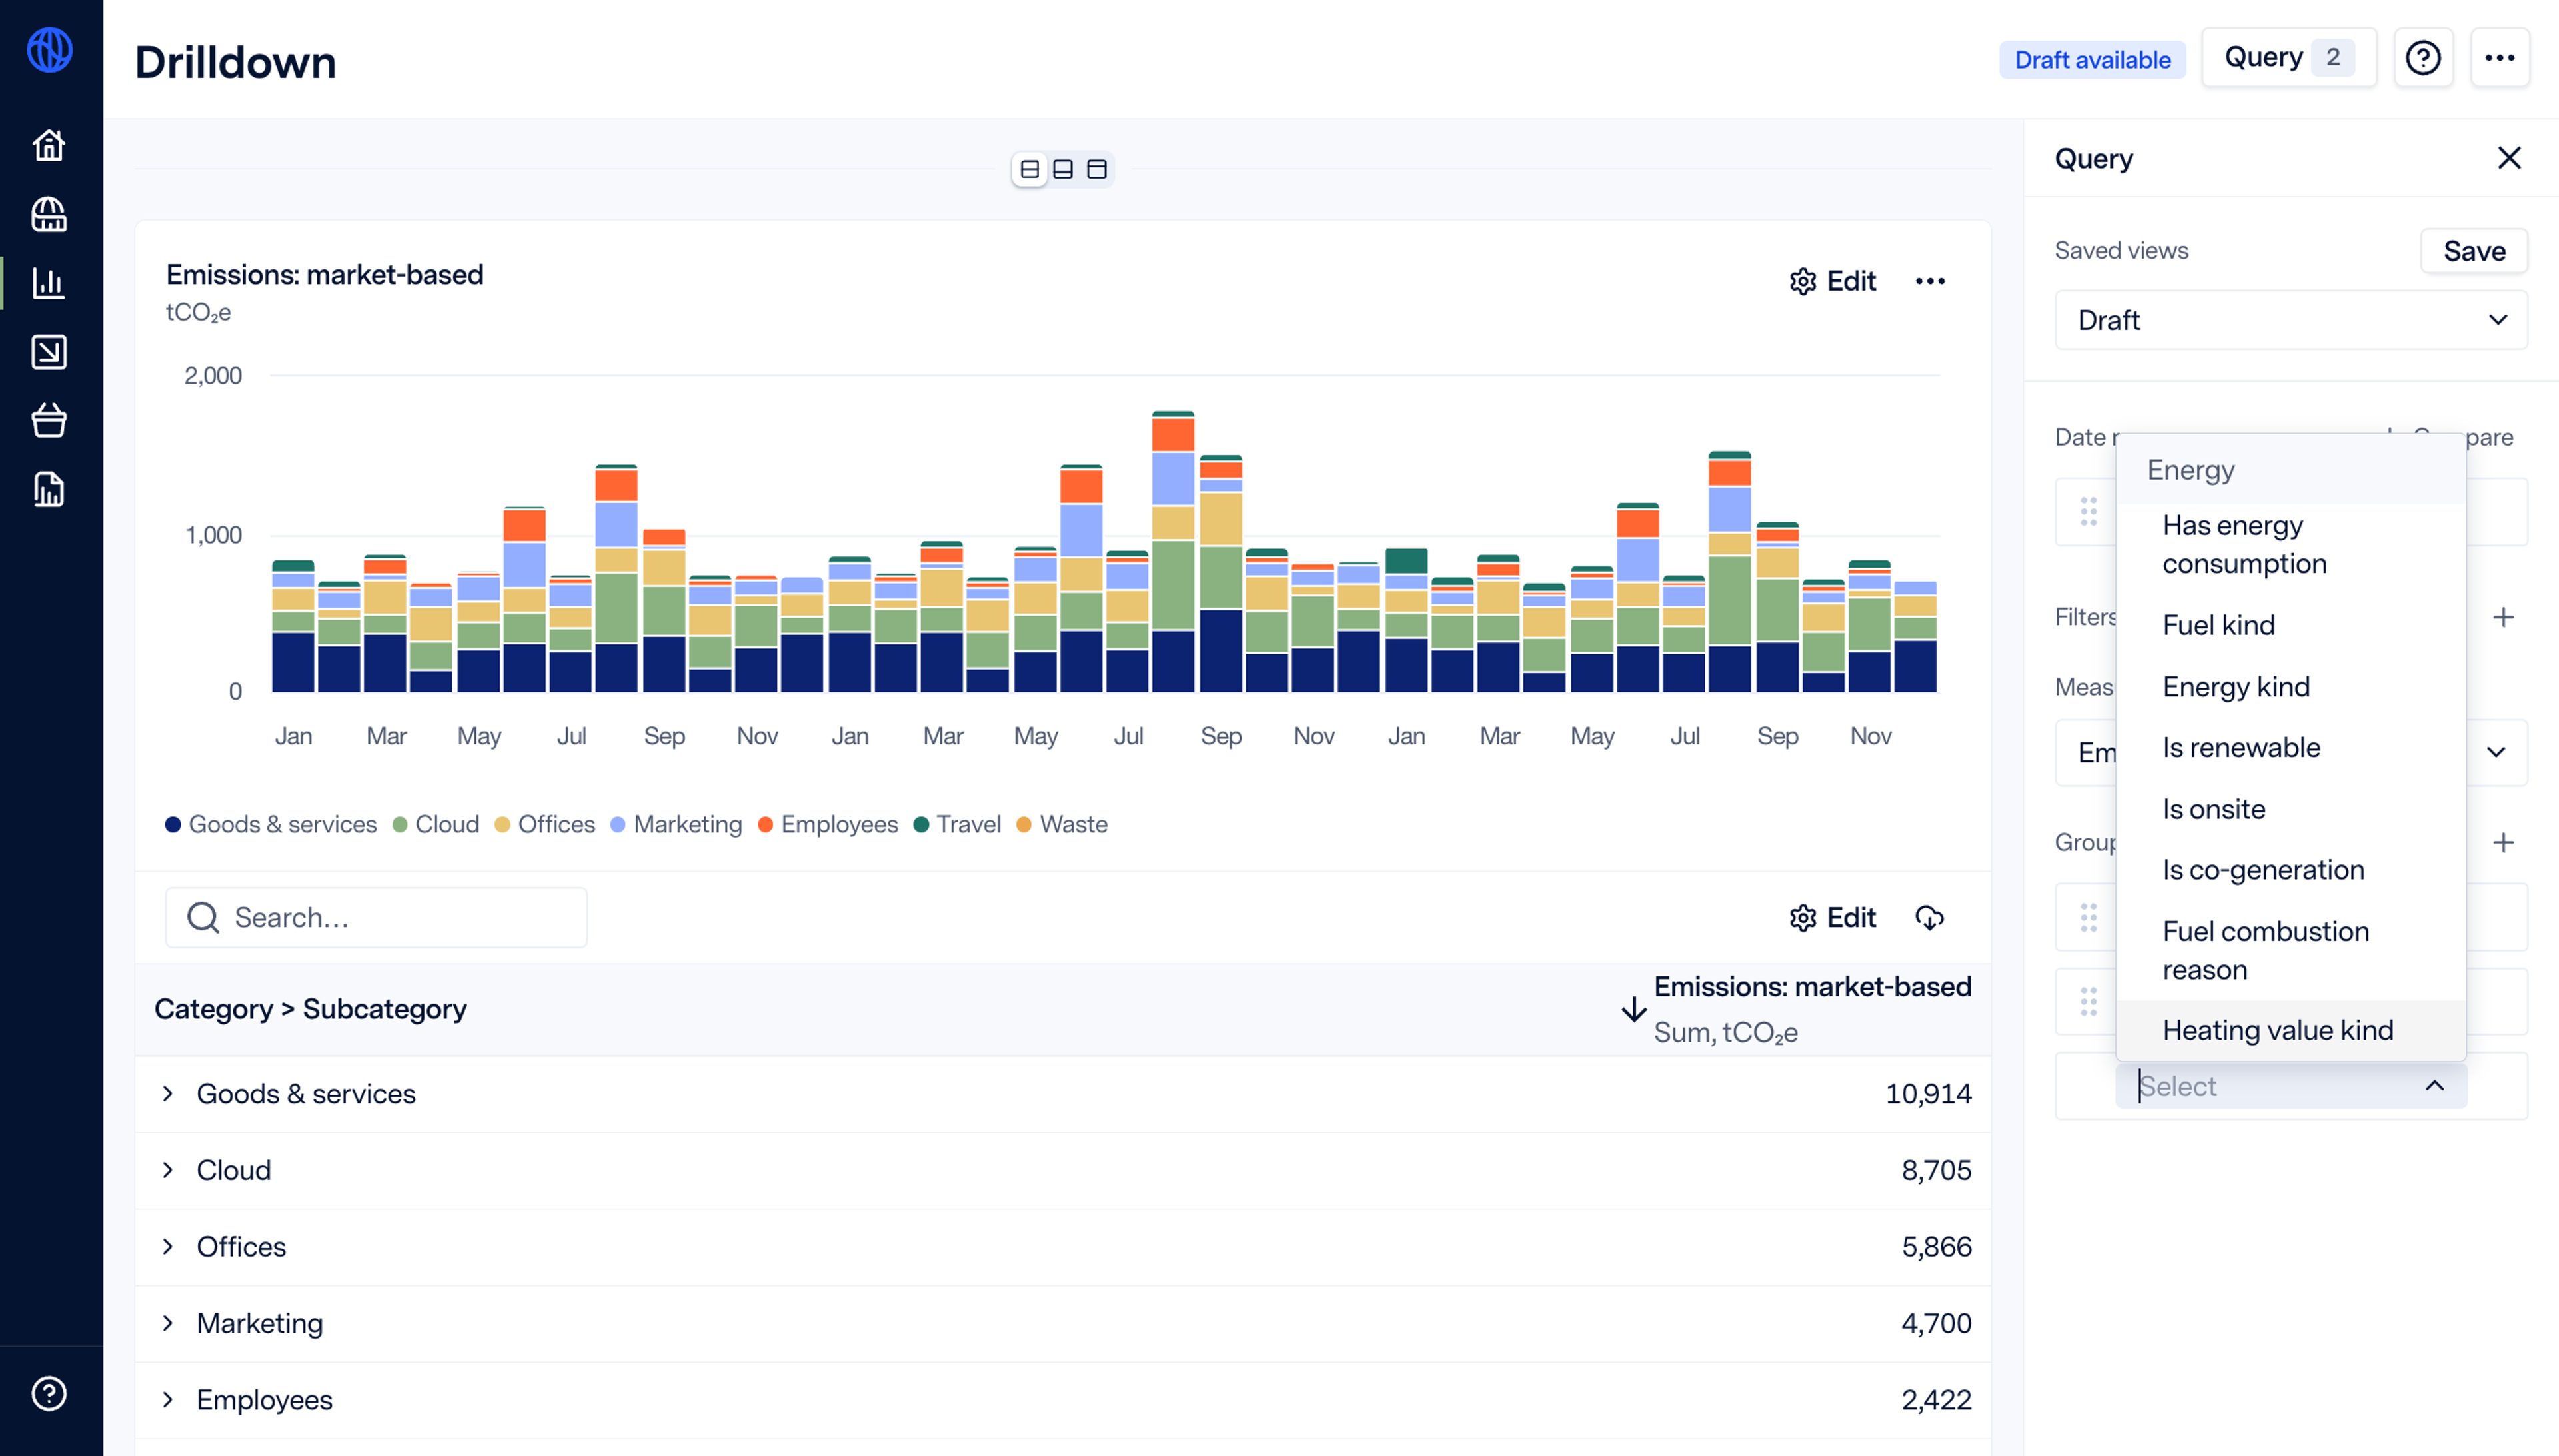
2. See non-carbon data in drilldown
Total energy consumption is a common metric asked for in reports like CDP and SECR, but it can be challenging to understand how those values are derived from input data. Now, you can see energy consumption data in drilldown, including detailed information on how metrics (like total energy consumption in kwH) are calculated. If you have purchased water and waste measurements with Watershed (beyond the regular waste measurement for GHG footprints), you will also now see water, waste and pollution in drilldown.
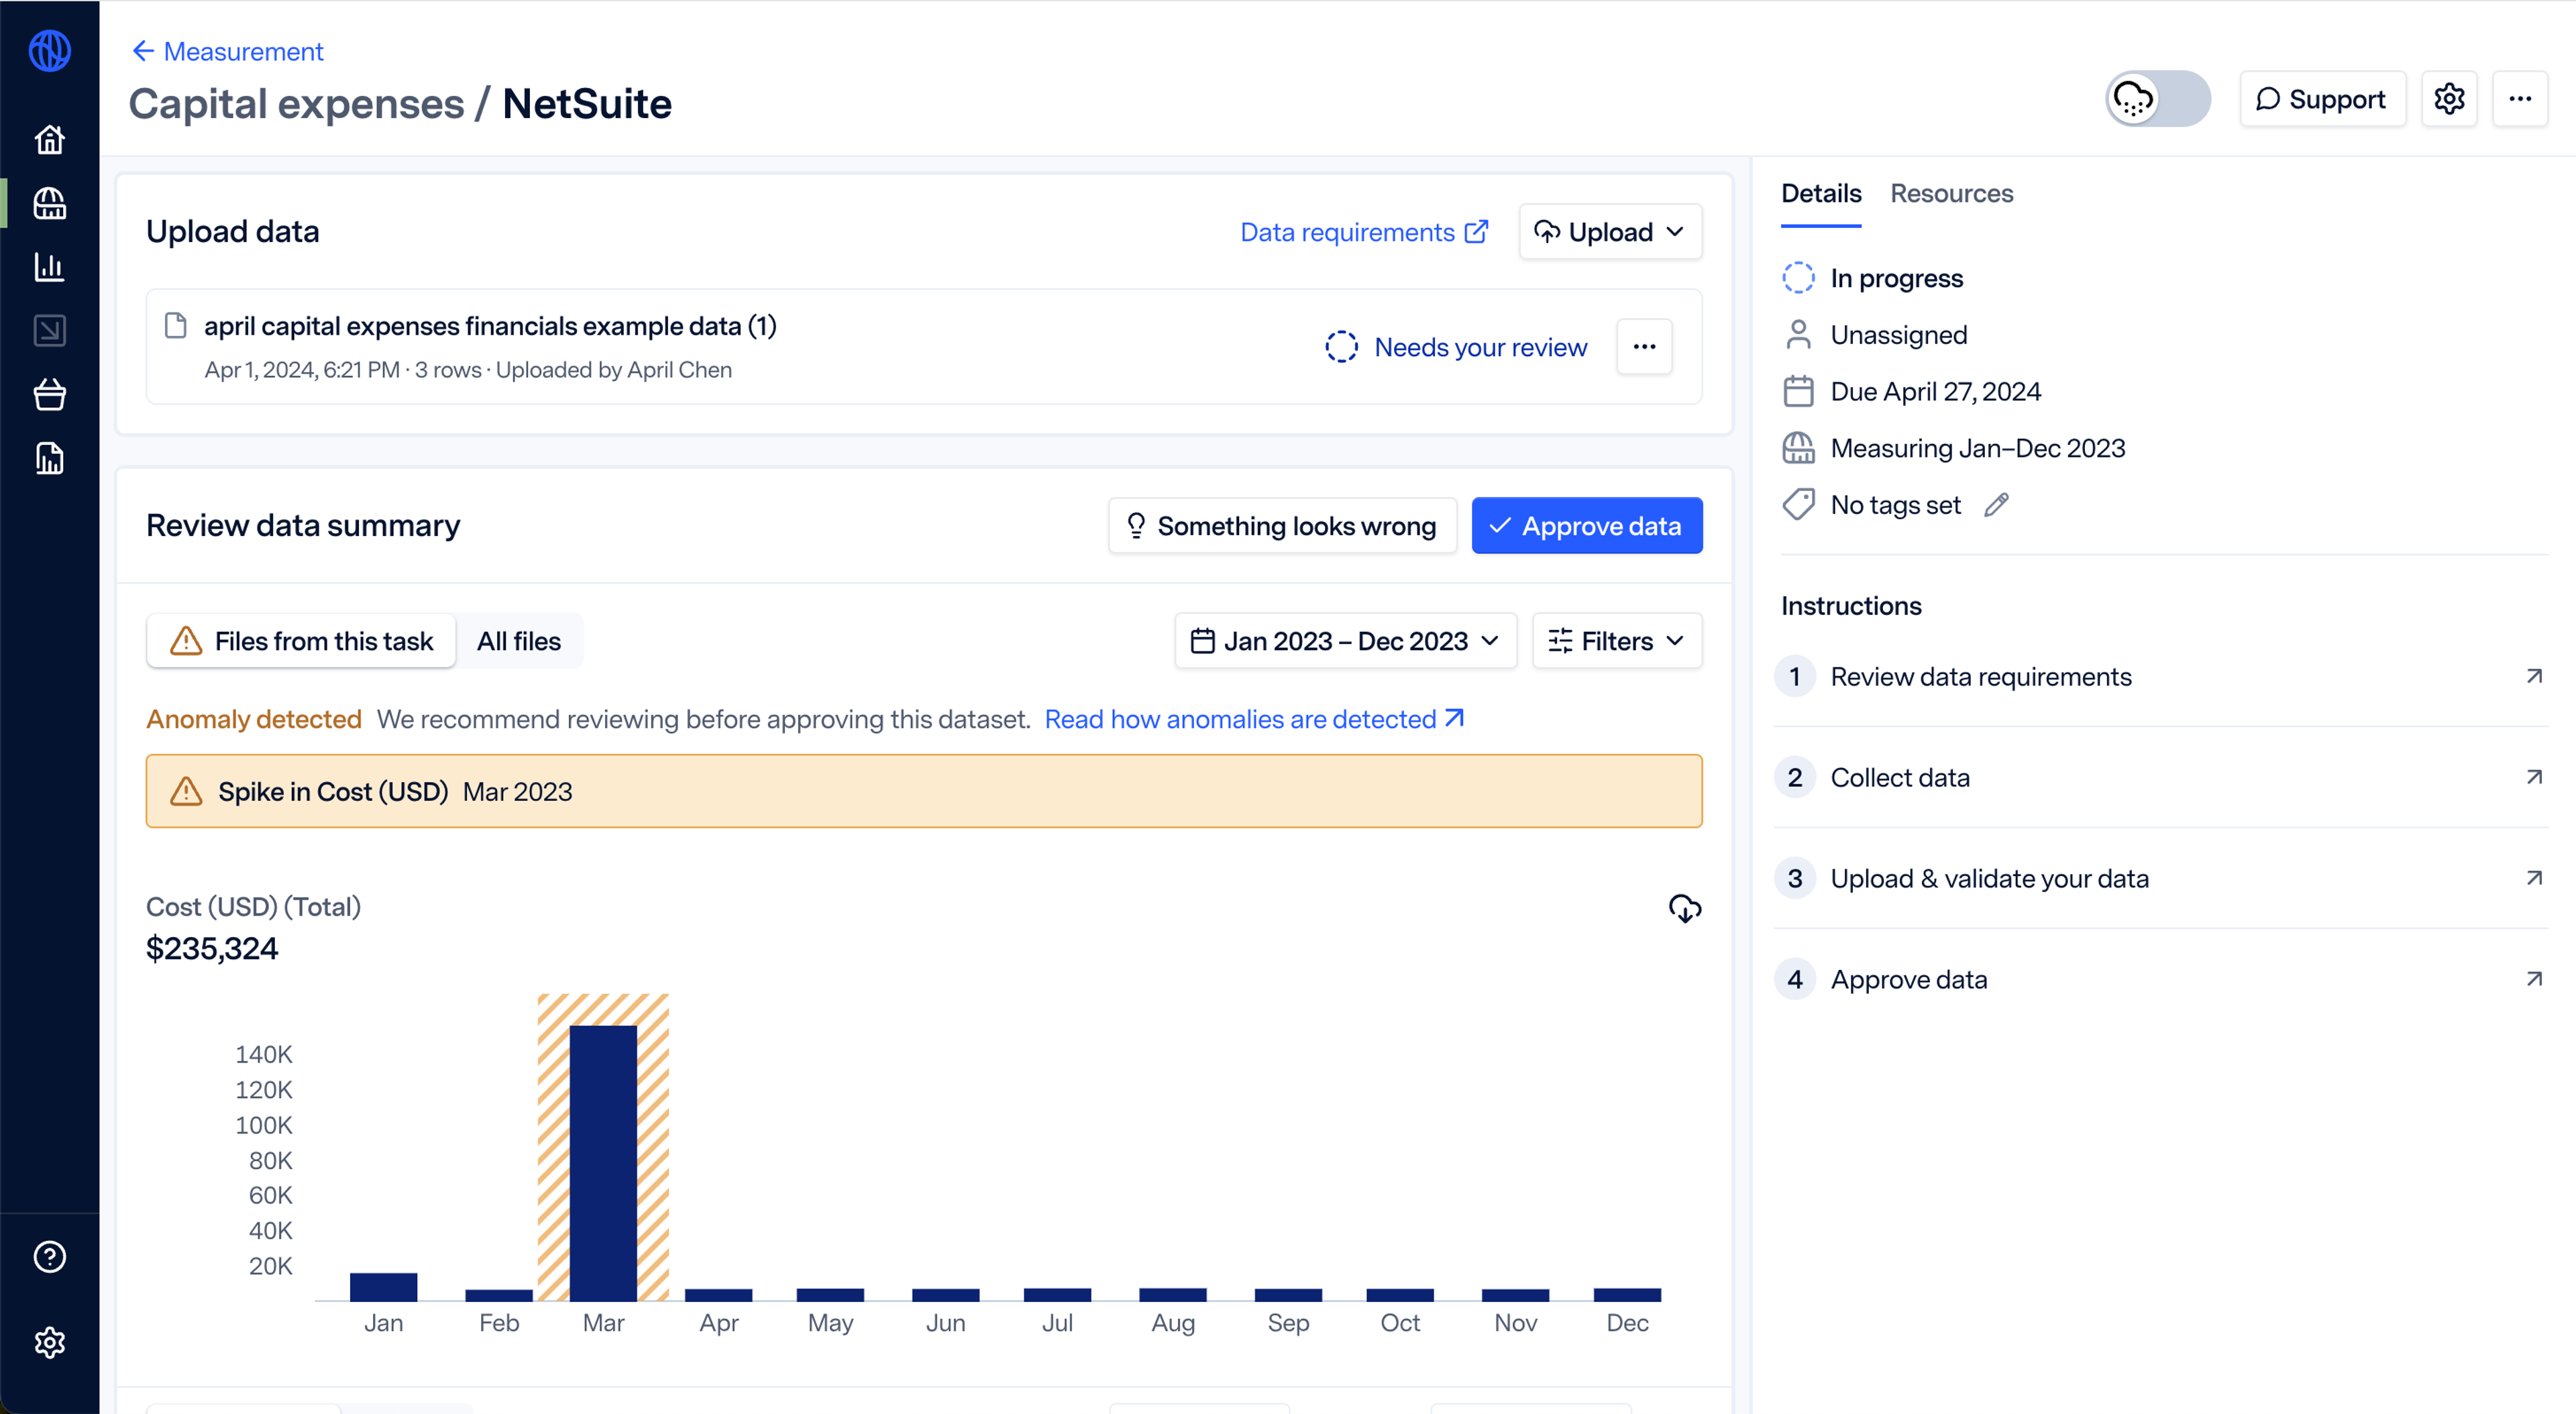
Upload, review, and approve data in one place
The review data summary step has been moved to center stage on the data upload page. Now uploading, reviewing, and approving your data can be completed as a seamless process in one place.
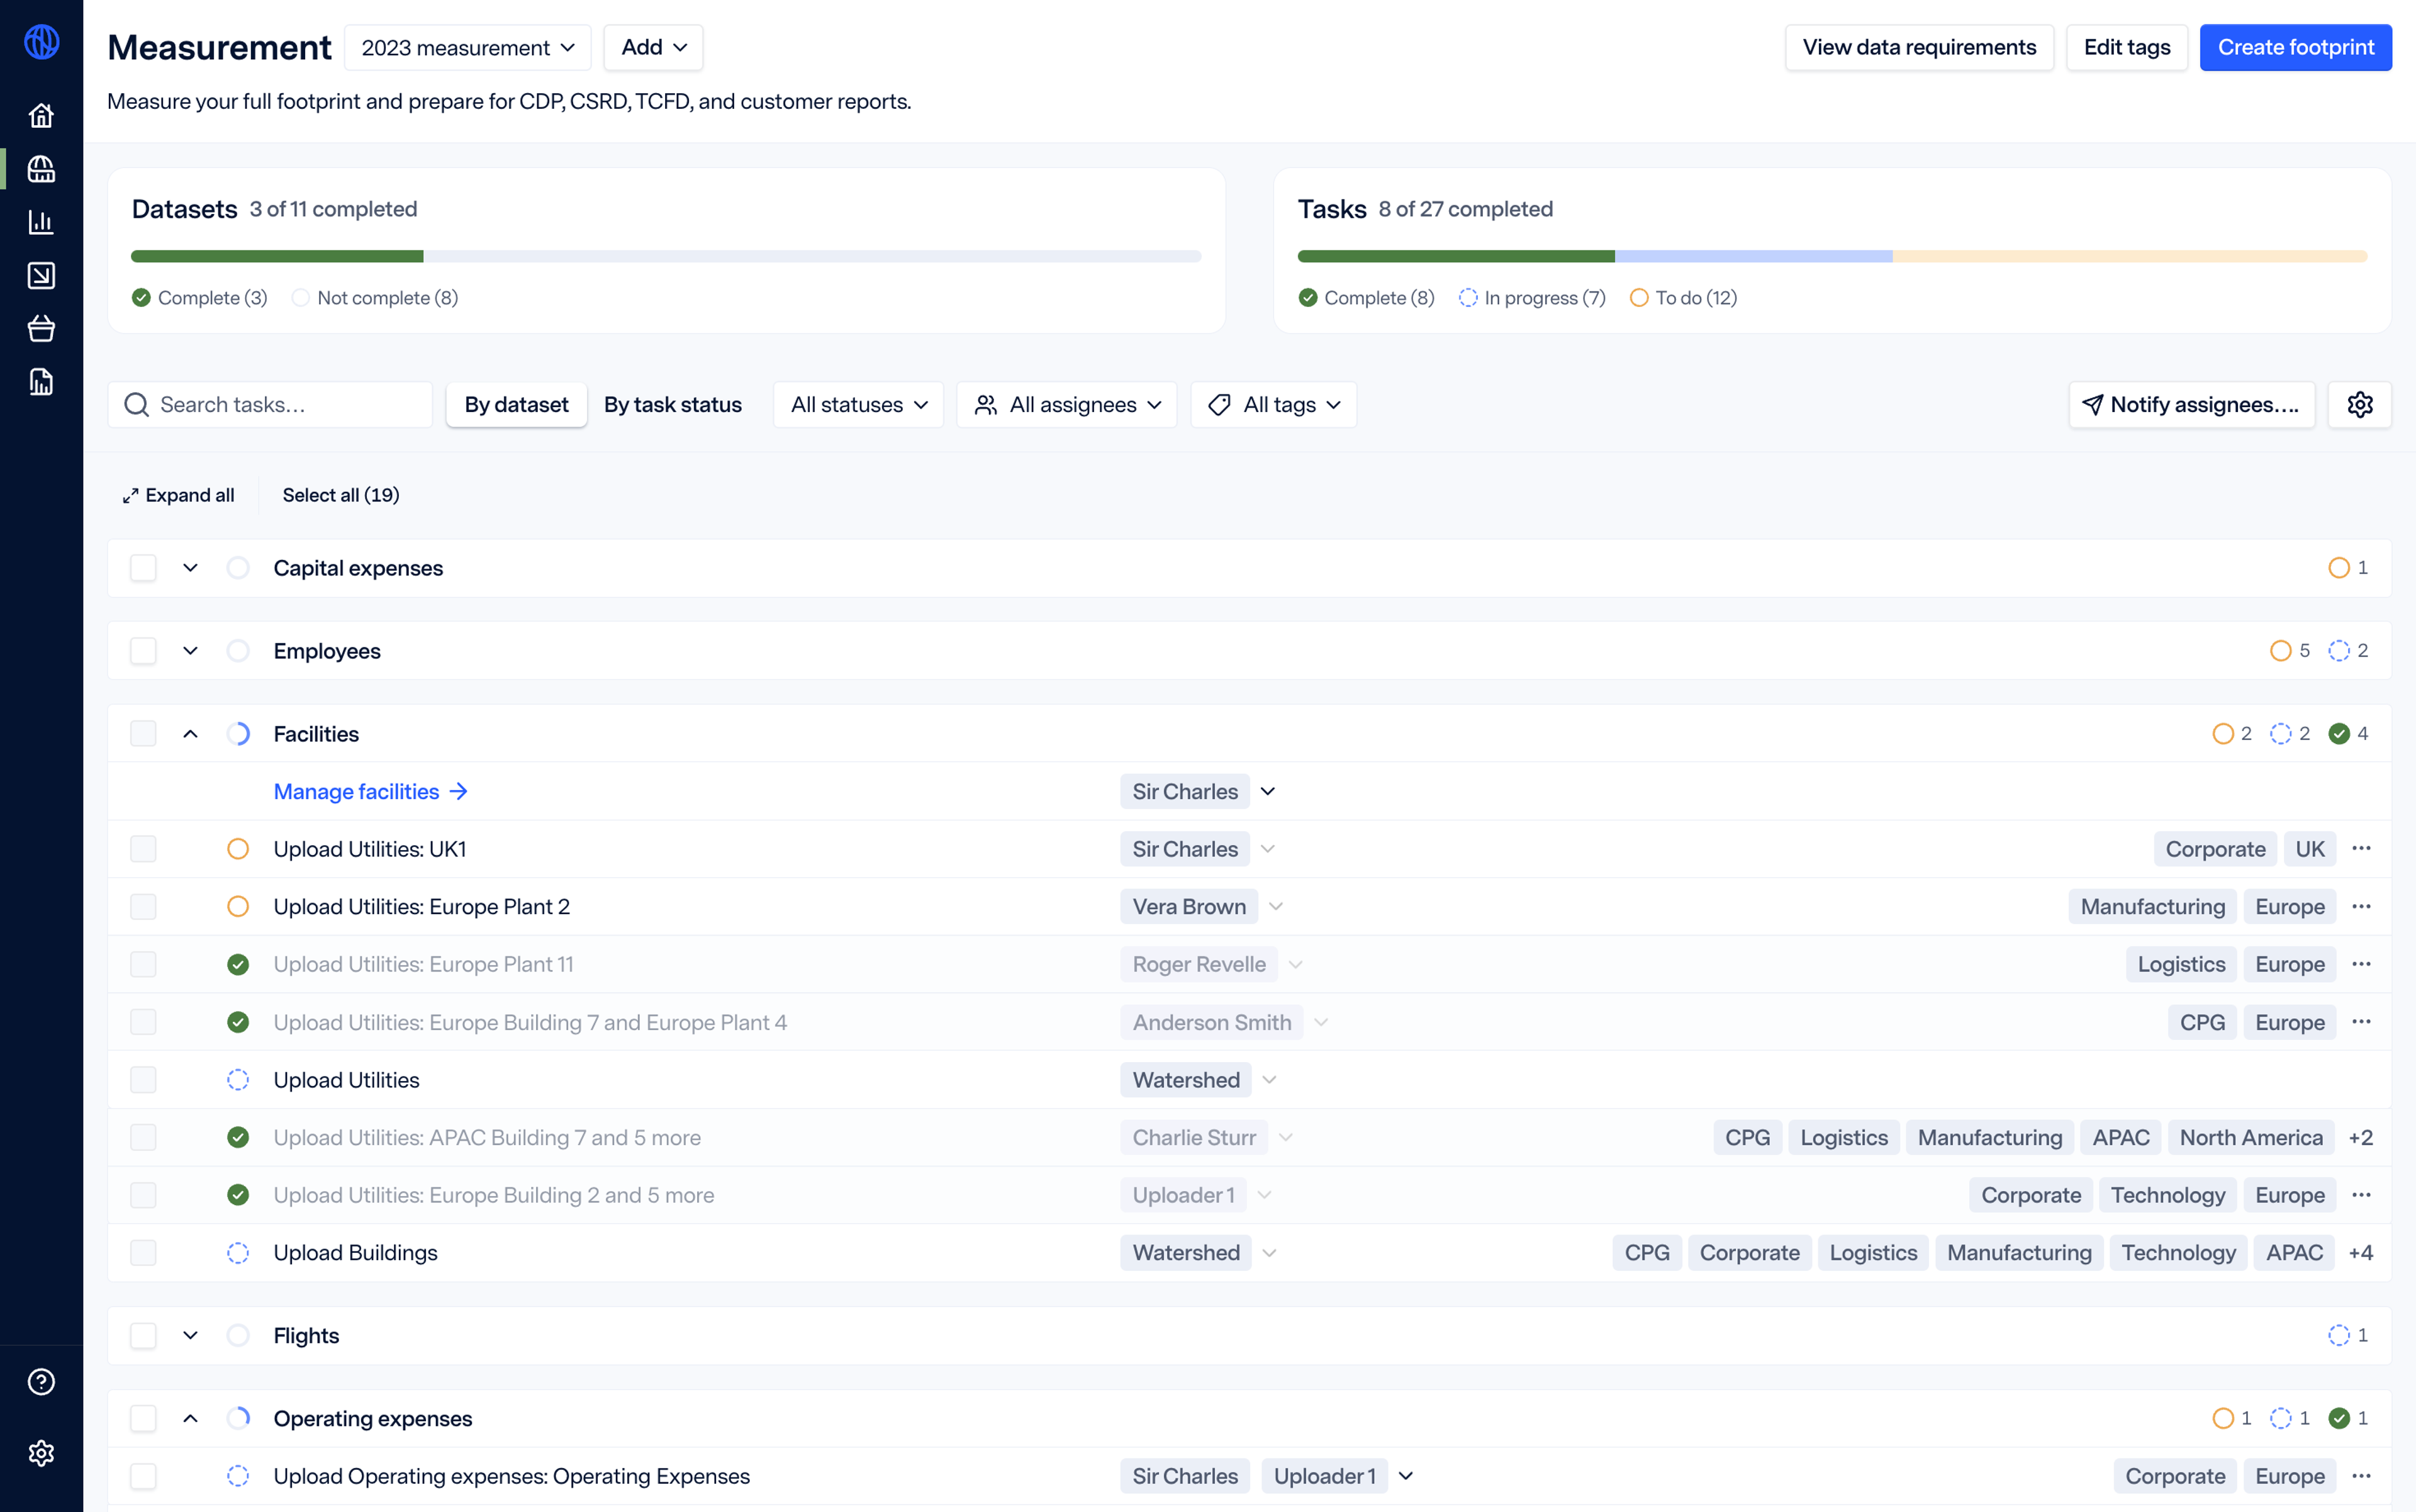
Organize your data with measurement tagging
Users with decentralized datasets (from multiple brands, business units, geographies, etc) can now organize their measurement data using custom tags. Measurement project managers can define tags, filter and view data upload tasks by tags, and overwrite tags for any dataset, even if the original data had a different value for those tags. These tags also carry over into the footprint stage—increasing granularity and allowing users to filter by tags in drilldown and reporting.
We hope you enjoy taking these new capabilities for a spin.