Product-level carbon footprints are only as good as the data underneath them. As more companies move from portfolio-level carbon accounting into product footprinting, the bar for data quality, transparency, and regional specificity keeps rising.
ecoinvent is the world's most widely used lifecycle inventory database, with a broad collection of data points on the environmental costs of thousands of industrial processes and materials. It’s a key data source powering Watershed's product footprinting capabilities. We sat down with the ecoinvent team to talk about what makes their data different, how regionalized precision changes the way companies model supply chains, and where the field is headed.
On the data
Tell us about the ecoinvent database. What sets it apart?
The ecoinvent database contains more than 26,000 high-quality environmental datasets covering processes across all major sectors and geographies. ecoinvent is an independent, non-profit association governed by leading research institutions. That independence matters: we have no commercial or political influences. Our only objective is to keep building the highest-quality sustainability database available and to innovate to meet evolving user needs.
Your database is peer-reviewed. What does that process look like?
Every dataset goes through a multi-layer quality control system before release. It starts with a technical screening to define scope and placement in the global database hierarchy. Authors then compile their process inputs, outputs, and emissions into our ecoEditor software, which enforces uniform formatting and requires full citation of sources. An independent external expert reviews the dataset in depth, with feedback routed back to the author for resolution. After that, at least two cross-cutting editors evaluate how the dataset interacts across emission types, data fields, and geographies, ensuring it integrates with existing background data without breaking downstream supply chains.
For companies relying on ecoinvent, this process is the assurance layer: every emission factor has been independently reviewed, transparently sourced, and harmonized across the wider database. The numbers behind their disclosures are defensible to auditors and regulators, and actionable. The same rigor that makes the data audit-ready helps sustainability teams identify what's driving their footprint and where action matters most.
You release yearly updates. How should practitioners think about version management?
ecoinvent releases a new major version every year. Each update typically refreshes most sectors, adds geographies, refines existing datasets with better primary data, and incorporates methodology improvements. But a release rarely changes everything; it deepens specific areas.
The right question for a practitioner isn't "Should I always be on the latest version?" It's "Does the latest release touch the parts of the database my footprint depends on?" If your reporting relies heavily on sectors we frequently update, like electricity, chemicals, or metals, a new version can meaningfully shift results. If your hotspots sit in a sector that wasn't in scope this cycle, the delta will be smaller.
Our recommendation: treat version updates the way you'd treat any methodology change. Lock to a single version for the duration of a reporting period so your year-on-year comparisons stay clean. Document which version you used. When you do migrate, run a parallel calculation on the prior year so you can separate real business changes from data improvements in the background database.
The Report of Changes we publish with every release flags exactly what moved and why, making recalculation and the accompanying narrative for auditors as straightforward as possible.
On the Watershed partnership
What made ecoinvent and Watershed a natural fit?
The scientific rigor, methodological consistency, and transparency that go into our datasets are exactly what's needed to power corporate sustainability programs that hold up under audit and regulatory scrutiny. Across Watershed's platform, ecoinvent emission factors underpin core carbon accounting, while our Unit Process Records and Life Cycle Inventory data power the deeper, product-level analysis that turns measurement into action.
How does ecoinvent data strengthen Watershed's product footprints?
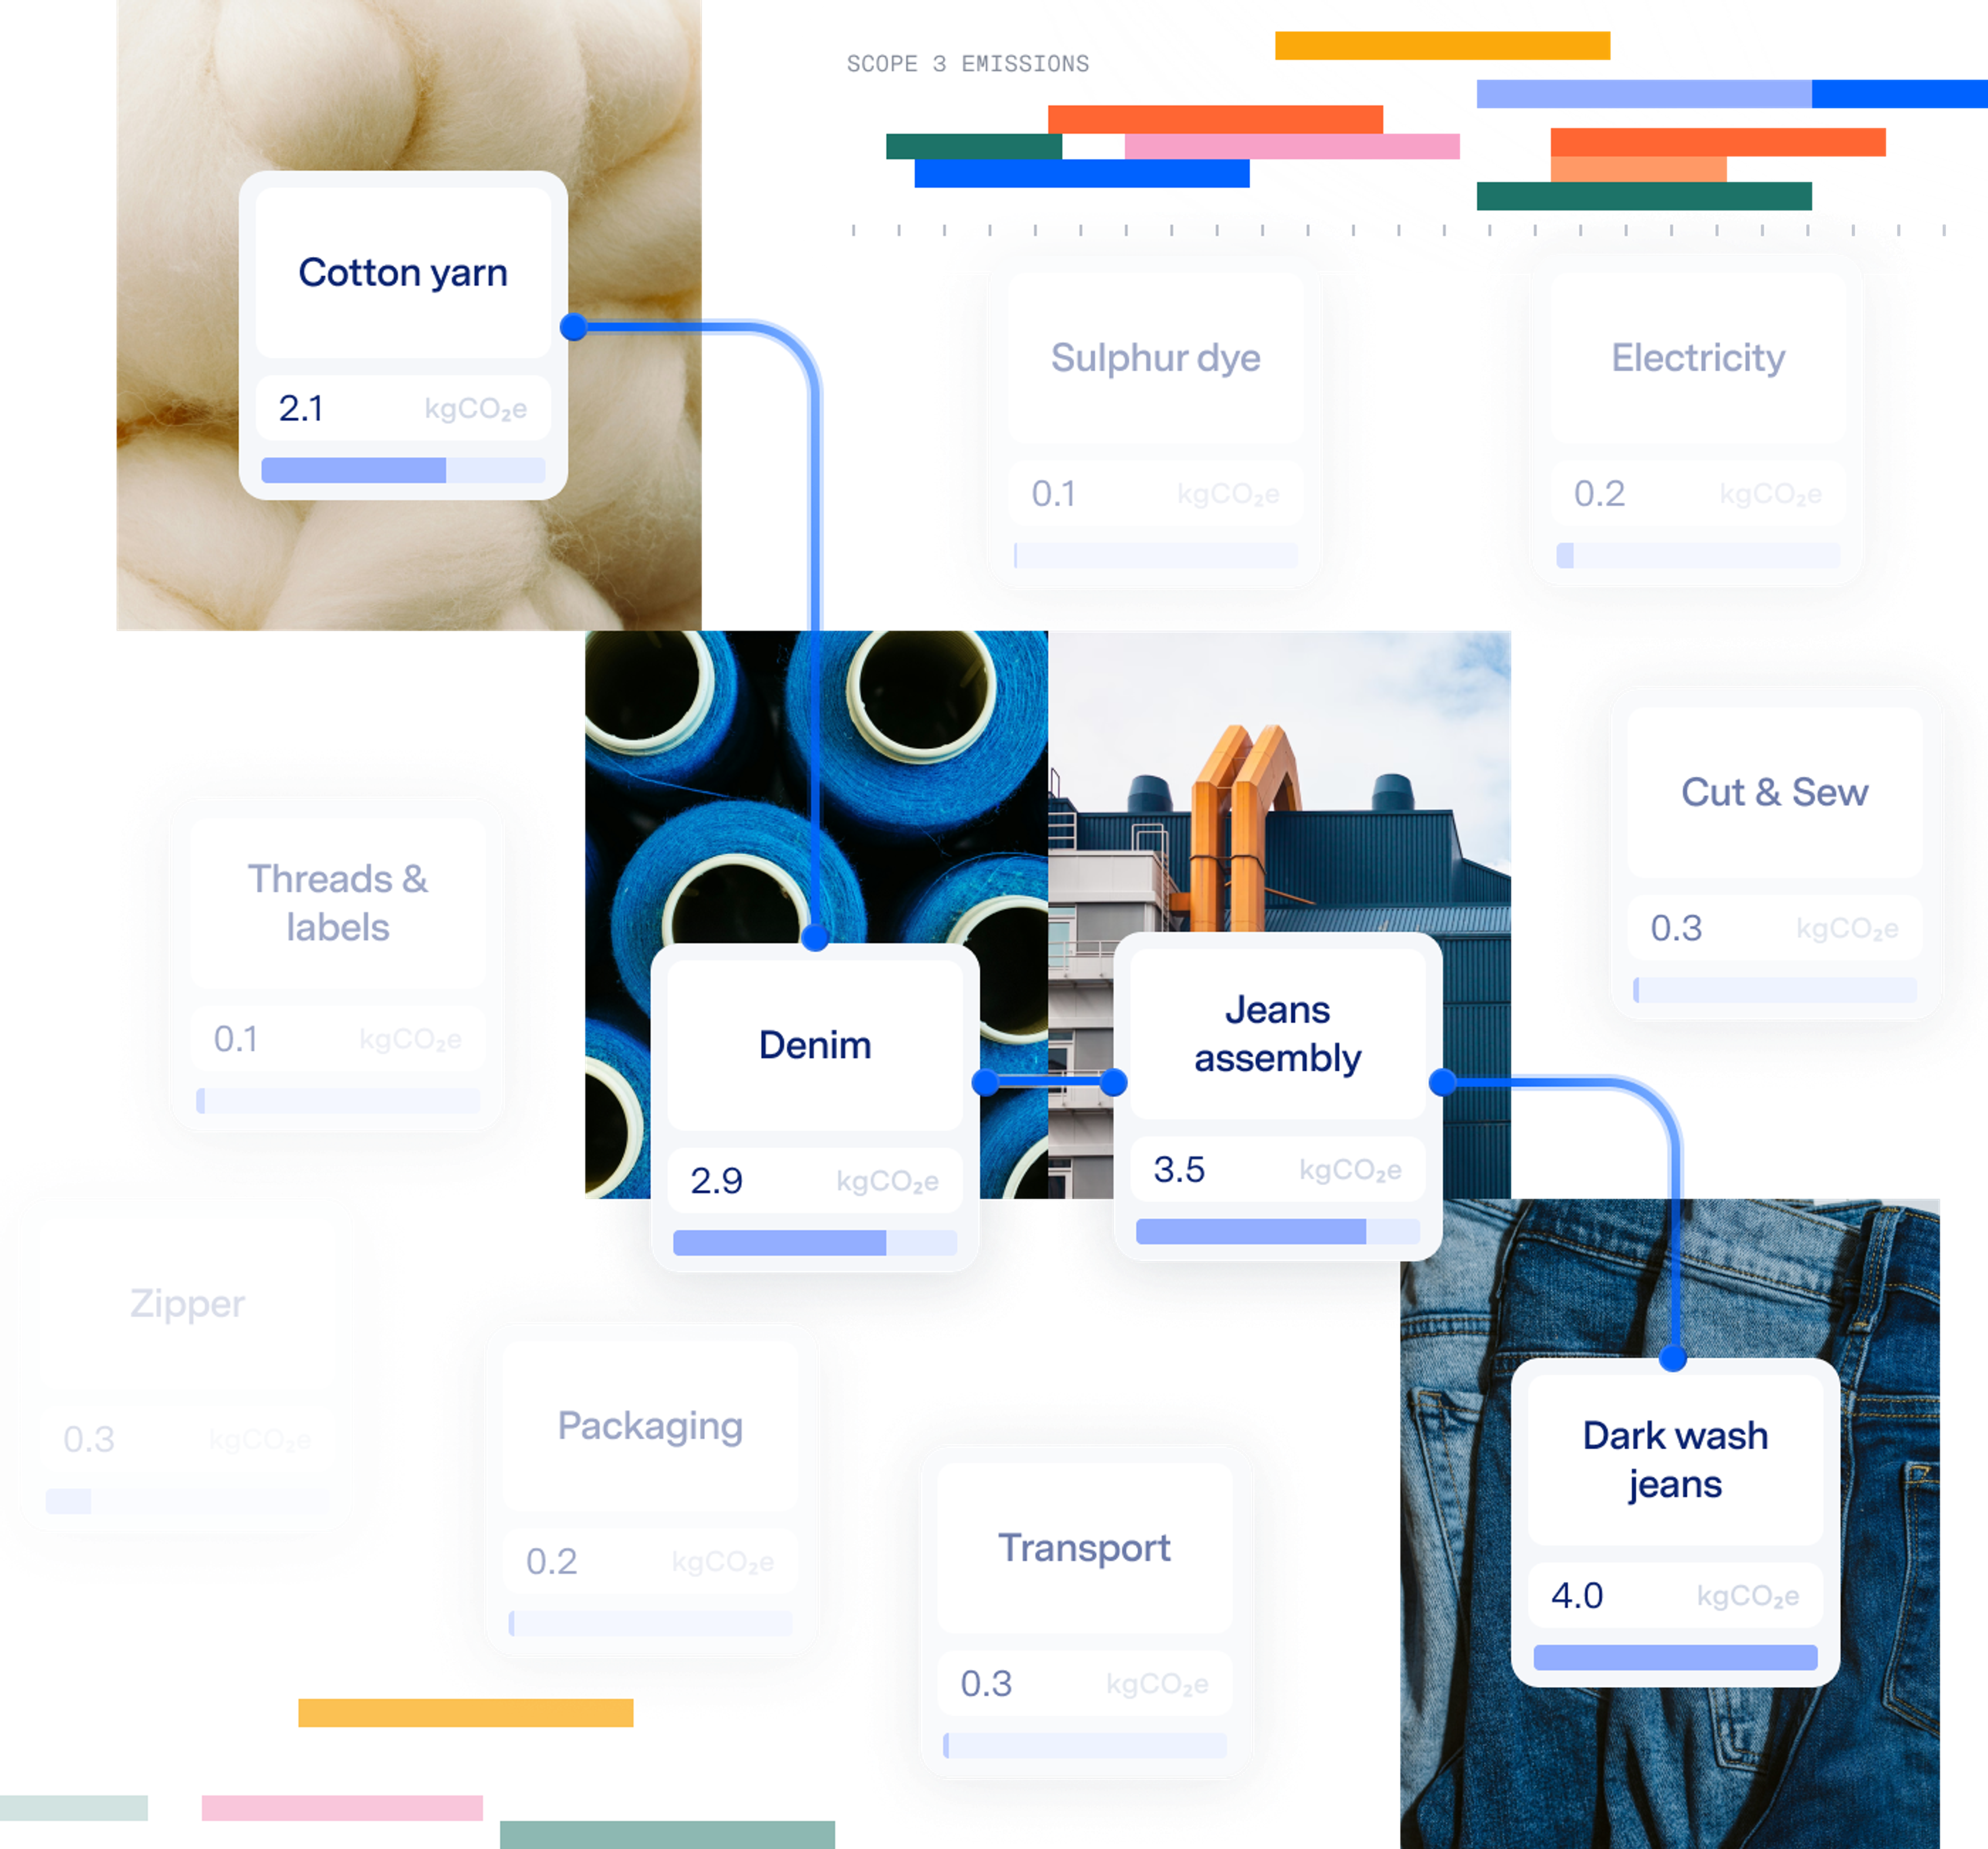
Watershed's AI can disaggregate a purchased product into its materials and processes quickly, but the value of that decomposition depends on what it maps to. ecoinvent isn't an emission factor library. It's a structured environmental model with process-level data, life cycle inventories, supply chain relationships, regionalization, and modeling logic underneath the factors themselves.
That deeper structure is what makes AI-powered footprinting useful rather than just fast. When Watershed's AI disaggregates products, maps supply chains, or identifies hotspots, it draws on the layer beneath the emission factor. The result is a footprint that's fast to produce, explainable to the people who need to defend or act on it, and grounded in independently reviewed datasets.
“That deeper structure is what makes AI-powered footprinting useful rather than just fast. When Watershed's AI disaggregates products, maps supply chains, or identifies hotspots, it draws on the layer beneath the emission factor. The result is a footprint that's fast to produce, explainable to the people who need to defend or act on it, and grounded in independently reviewed datasets.”
ecoinvent

On methodology and regional precision
What does "regionalized precision" mean in practice?
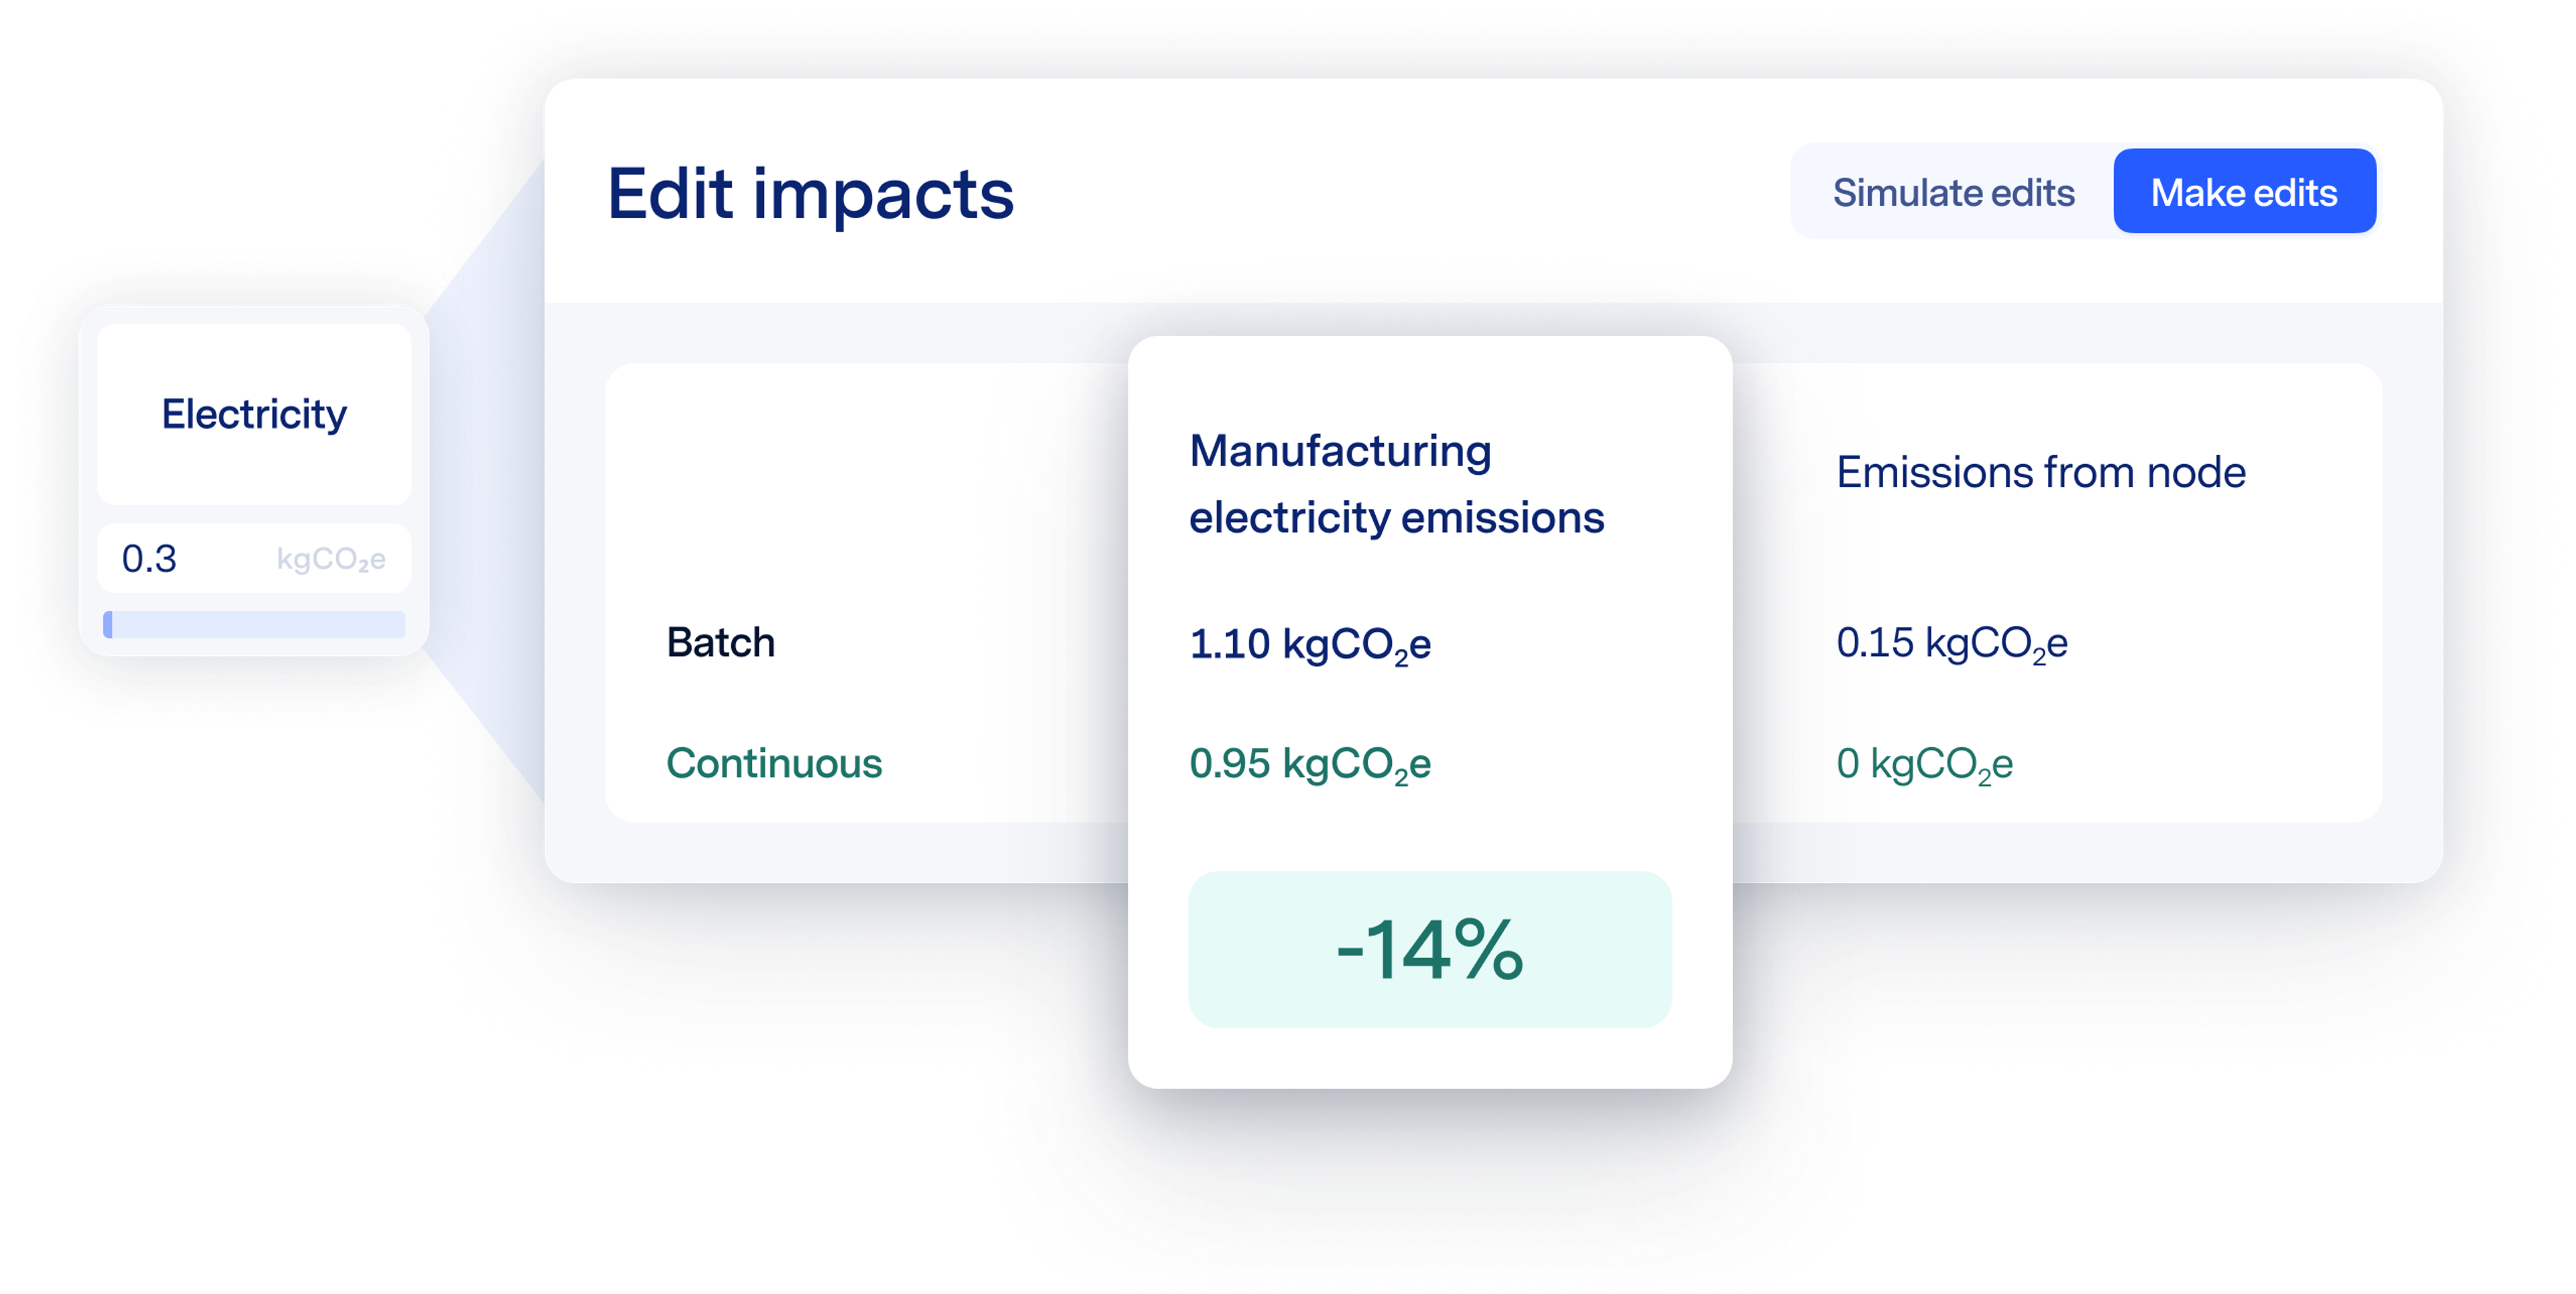
It means matching each input in a supply chain to a dataset that reflects where it was produced, not a global average. The differences are significant: aluminum made with hydropower in Iceland carries a fraction of the emissions of aluminum made on a coal-heavy grid elsewhere. Global averages collapse those gaps. Regional datasets surface them.
Our strategy has three parts: expanding regional coverage by adding regionally differentiated processes and partnering with national initiatives; renewing our approach to trade modeling to capture where goods are produced, how they move, and where they're consumed; and integrating regionalized life cycle impact assessment so we capture not only where activities occur but how local conditions shape their impacts.
For companies, this matters for accuracy, since the wrong regional proxy can shift a footprint enough to mislead internal decisions and external disclosures. And it matters for action: regional data is what lets procurement and sustainability teams compare suppliers across geographies, quantify the impact of relocating production, and build decarbonization roadmaps that hold up under frameworks like CBAM or the EU Battery Regulation.
Can you share an example where regional data made a meaningful difference?
Here's one from our Climate Week Zurich panel this past May. A Watershed customer in the forestry and paper sector wanted to decarbonize their print supply chain across six vendors in different regions. The typical approach would have been engaging each supplier individually. Instead, the analysis used regional, activity-level electricity emission factors rather than global averages. A clearer pattern emerged: the dominant emission driver across all six suppliers wasn't the printing process itself. It was the carbon intensity of the local grids powering it.
That insight reshaped the intervention entirely. Instead of running fragmented supplier projects, the company brought all six vendors into a single cohort that co-funded a solar plant through a virtual power purchase agreement, leading to a sharp reduction in embedded emissions.
Looking ahead
What's the biggest misconception companies have about LCA data?
A common one is treating an LCA result as a static number rather than a transparent model of a system. Companies pull a footprint, report it, and move on. But the real value is what's behind the number: which inputs are driving the result, how confident you should be in each one, and what changing a supplier, region, or process could mean for both cost and environmental impact.
A related blind spot: assuming one depth of data fits every use case. Aggregated emission factors work well for broad carbon accounting across a portfolio. But the moment a company needs to explain, defend, or act on a specific number, they typically need to see one level deeper into the unit processes and life cycle inventories that build up to that factor.
A third misconception is the belief that companies need perfect supplier-specific data before they can start making decisions. They don't. High-quality background databases let organizations build defensible footprints today, identify hotspots, prioritize interventions, and refine data quality over time. That combination of Watershed's platform and ecoinvent's data is how companies act now rather than wait for perfect information.
ecoinvent's next major release will be a significant update. How do you balance innovation with consistency?
What's coming isn't a routine annual update. The fourth generation of ecoinvent will be a multi-year, generational transformation on three fronts: better regionalized precision, increased scale of high-quality data, and greater flexibility through a restructured data model. It's the most ambitious step we've taken since v3 launched in 2013. Learn more about what's coming in ecoinvent v4.
We balance that ambition by communicating transparently. Every release comes with a detailed Report of Changes so practitioners can see exactly what moved and why. Our system models preserve methodological continuity even as datasets evolve, and predictable release cycles let users plan migrations. The editorial review process that gates new data is the same one that protects existing data from cosmetic changes. For v4, we've added a multi-stage beta program that lets feedback from key users shape the platform before it ships.
“What's coming isn't a routine annual update. The fourth generation of ecoinvent will be a multi-year, generational transformation on three fronts: better regionalized precision, increased scale of high-quality data, and greater flexibility through a restructured data model. ”
ecoinvent
Thanks to the ecoinvent team for taking the time to discuss their upcoming release with us. Having the right level of precision in your emissions data can unlock enormous potential for your reductions strategy and better avenues for supplier engagement. Learn more about the ecoinvent partnership and all of the emissions data now inside Watershed Product Footprints.