
Ask four experts for the carbon footprint of an identical AI query on the same model, and you will likely get four defensible answers, spanning orders of magnitude. This divergence is driven by the electricity that powers the prompt: where the compute ran, and how that power gets counted.
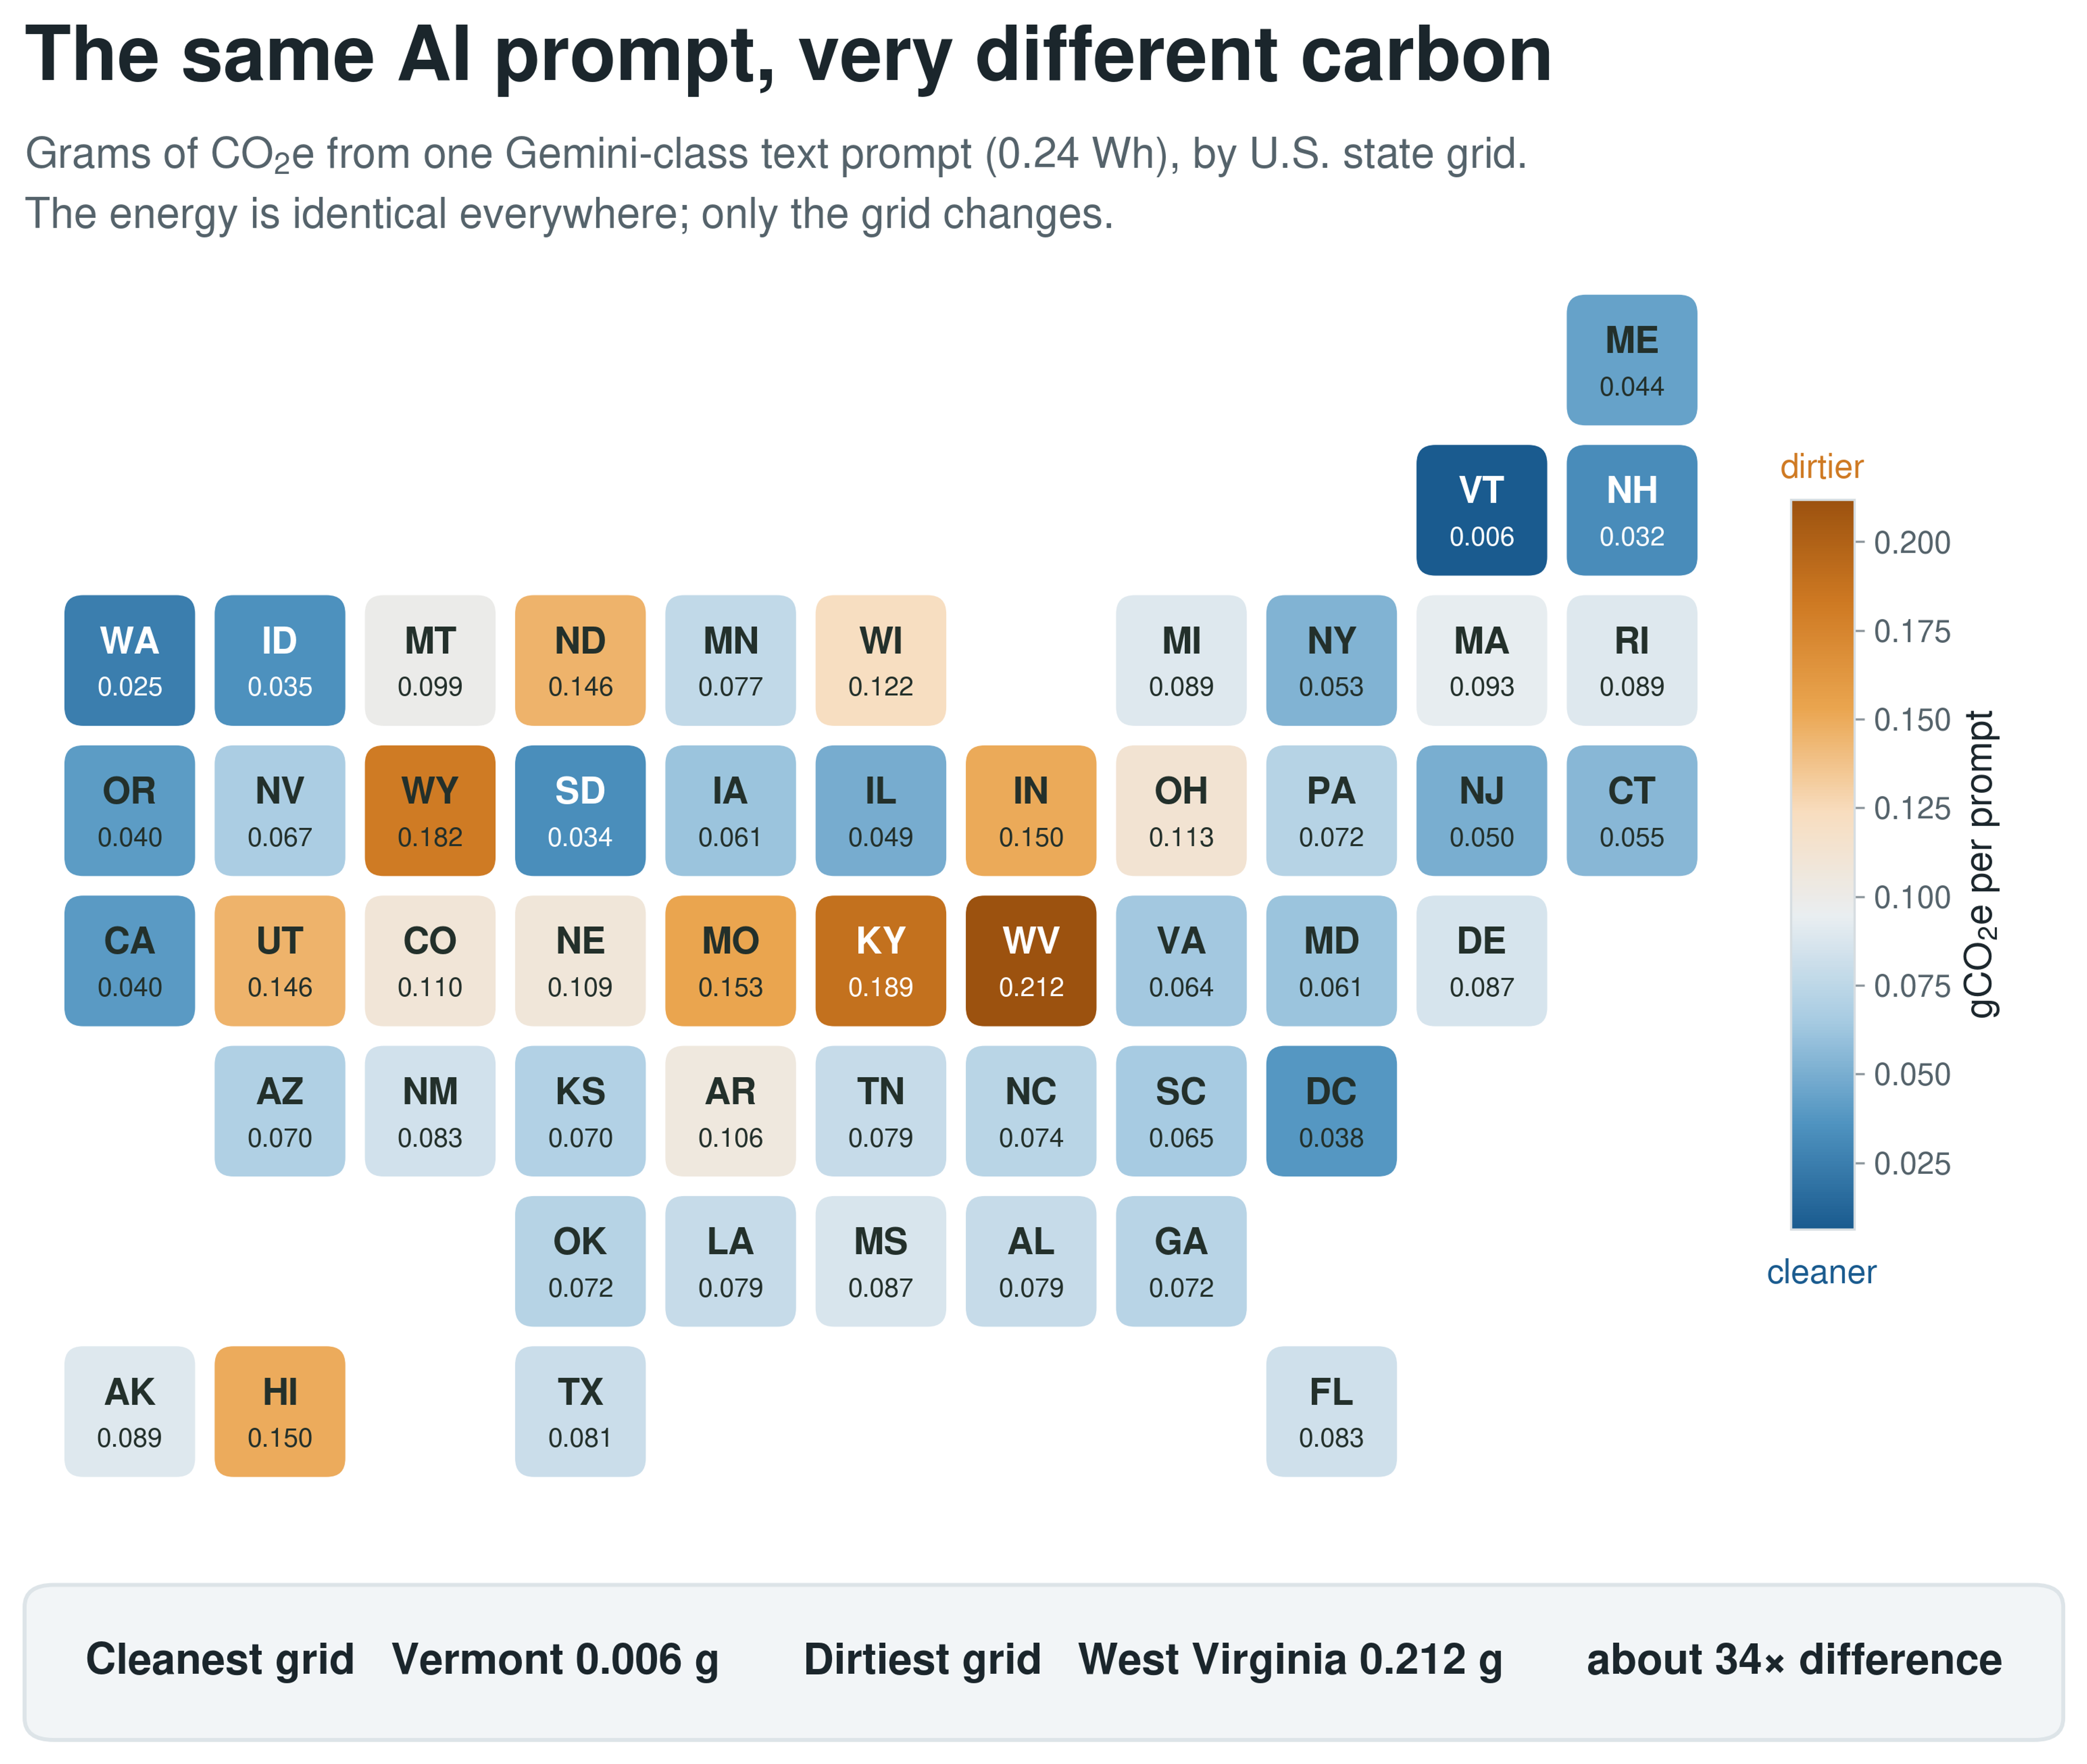
A prompt’s footprint depends on where it runs
Google shared that a median Gemini text prompt uses about 0.24 watt-hours of electricity, roughly 2% of a phone charge. But an agentic call can span 50 to 500 watt-hours, enough to microwave a burrito for half an hour (please don’t).
Now hold electricity fixed at Google’s median and change just the grid. In Vermont’s hydropower-rich grid, the prompt emits about 0.006 grams of CO2. On West Virginia’s coal-heavy grid, the prompt emits closer to 0.212 grams, a 34x spread. Current grid emissions intensities tend to be lower on average in the West and Northeast but dirtier through parts of the Upper Midwest and Appalachia.
In other words, your prompt is cleaner in Seattle than in St. Louis. Geography plays a starring role, despite using the same question and the same electricity.
This isn’t about the user’s location—your prompt travels to a data center that may be a thousand miles away, depending on the provider’s siting and routing decisions. That data centers grid is the one that counts for emissions, not the ZIP code where you are sitting.
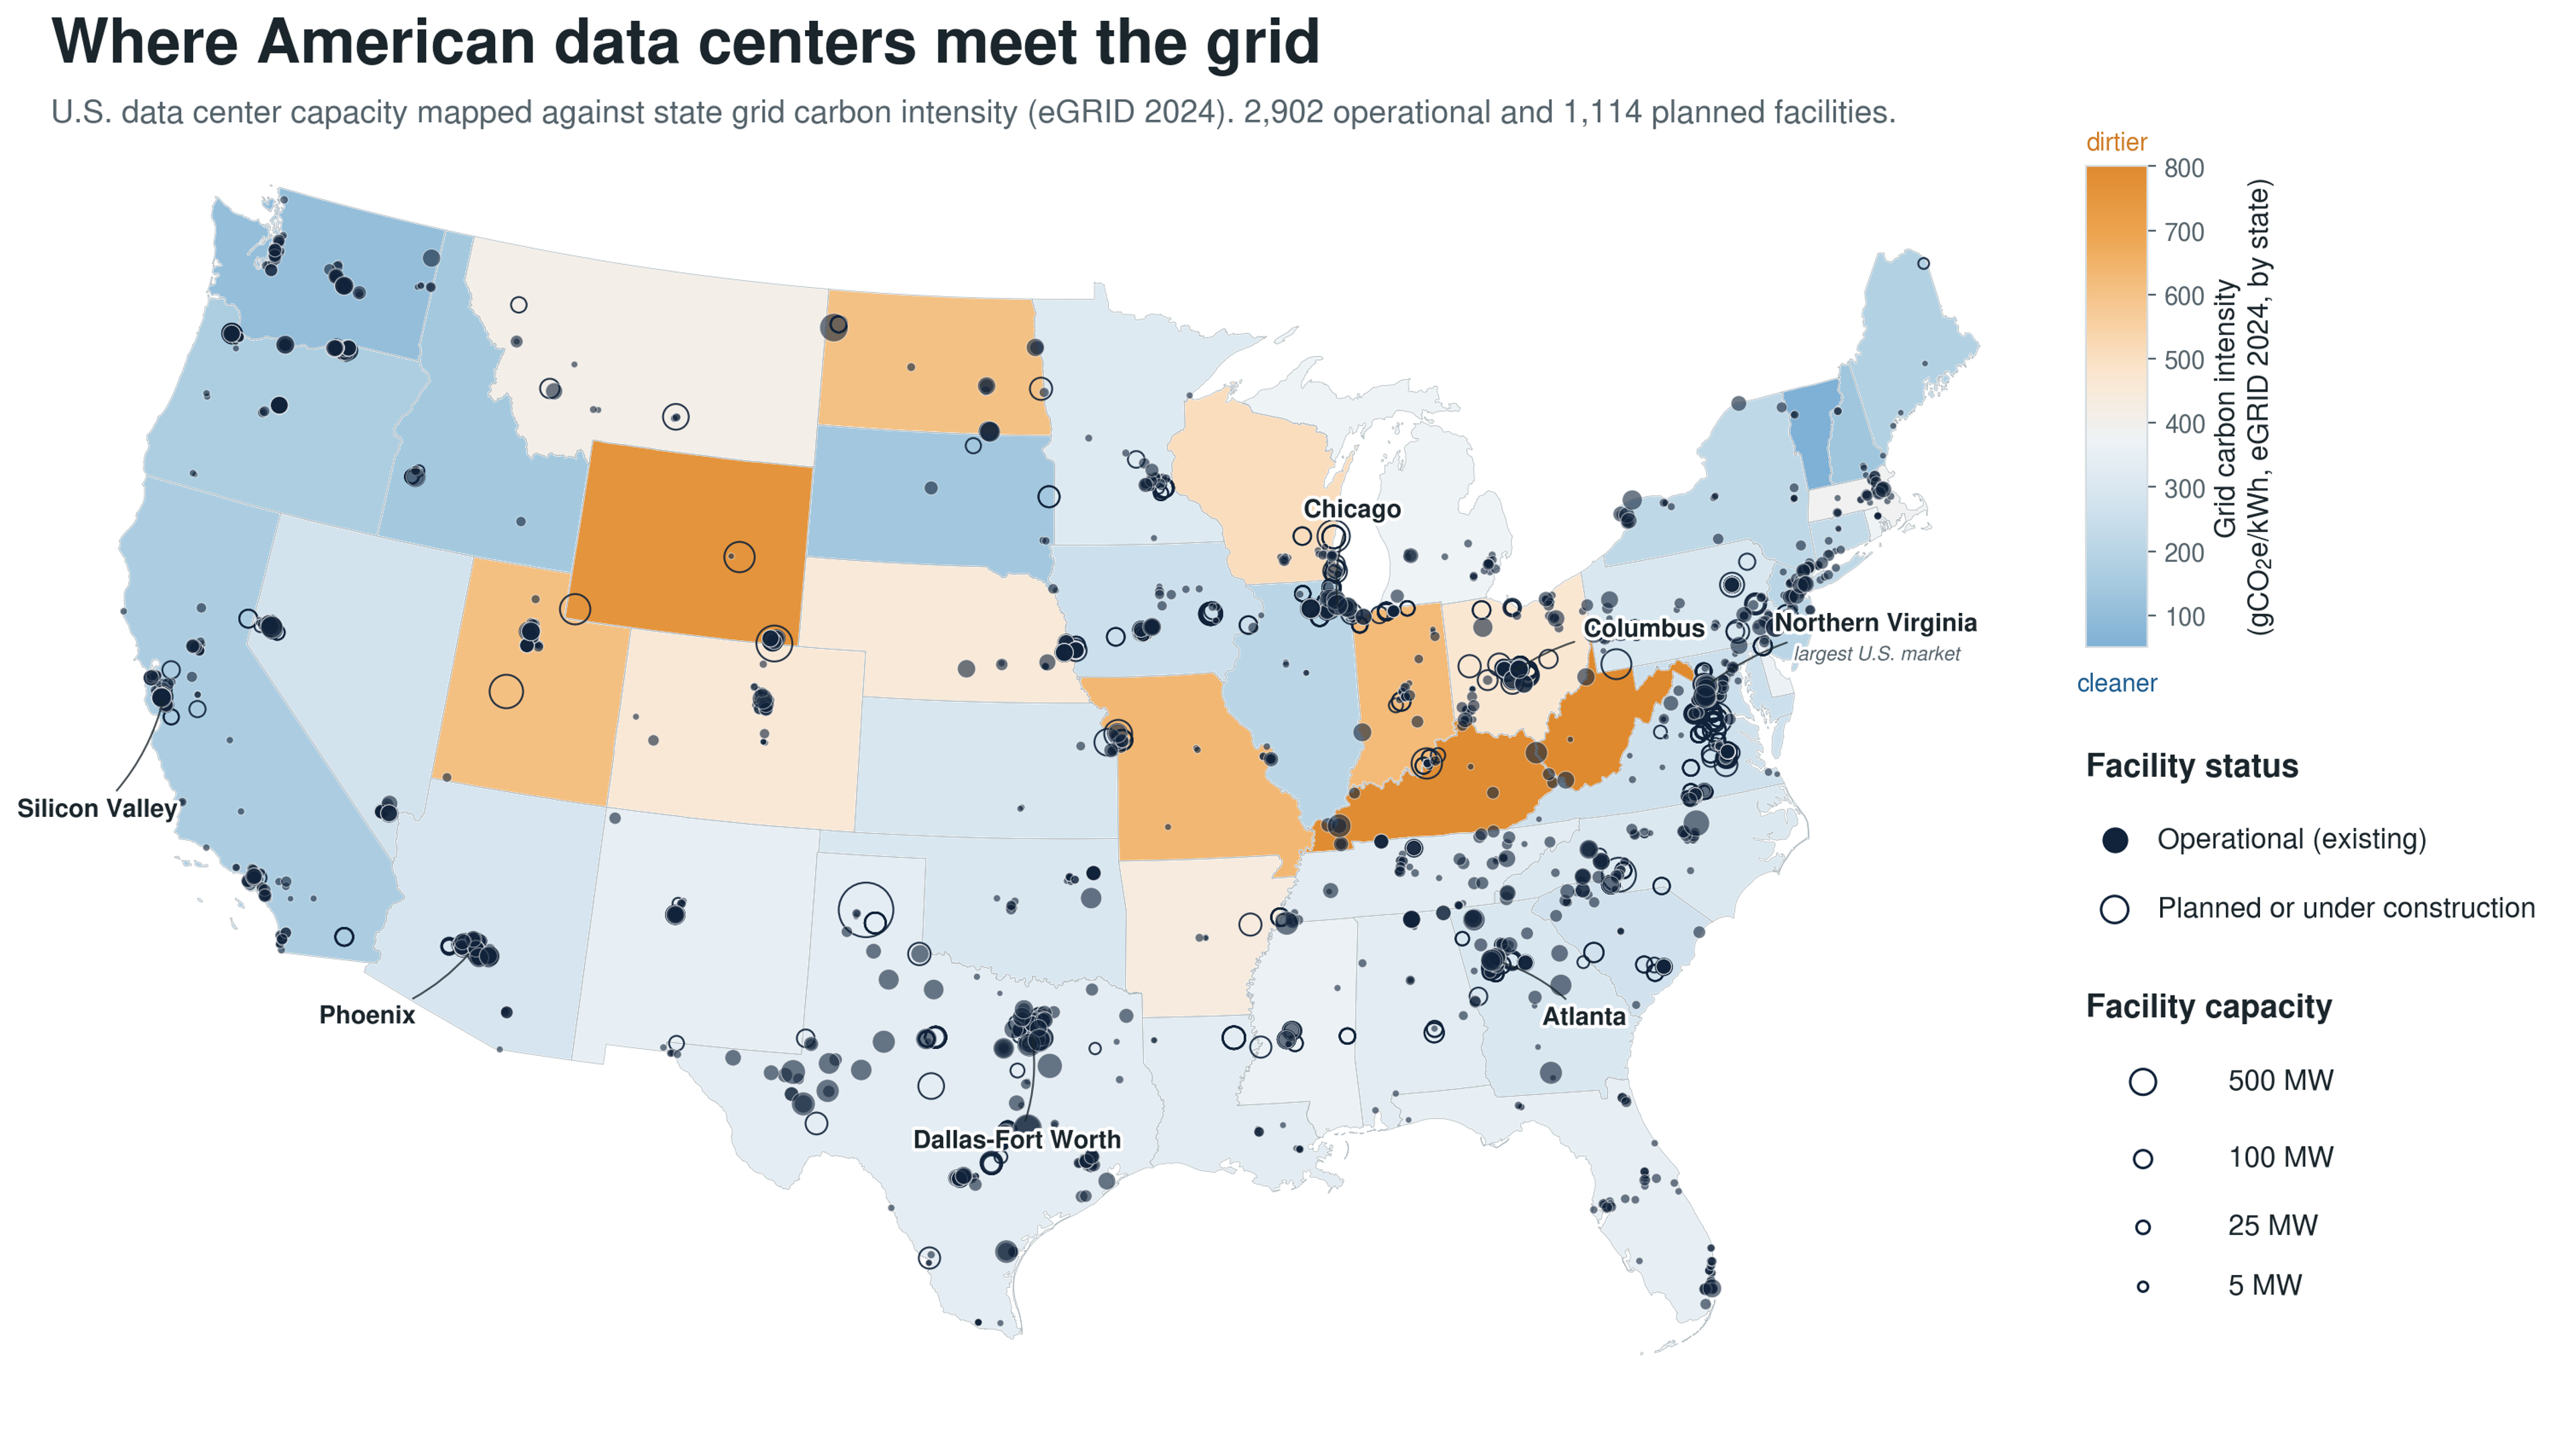
Who decides which grid serves your prompt? In most cases, the provider’s routing system sends requests to whichever region has capacity at the moment. Two identical prompts sent minutes apart may drift onto different grids. Companies that buy compute through a cloud or API can often select a region, but if you’re typing into a consumer chatbot, you (currently) can’t.
The carbon intensity of America’s data centers is projected to increase from about 307 grams of CO2e per kWh today to 351 with planned projects—a nearly 15% increase (when weighted by data center capacity). The pipeline of announced data centers is now larger than everything built to date, which means the marginal data center matters more than the average one.
The decisions being made now about where data centers are built and how they’re powered will affect the grid for decades. That infrastructure will outlast any model generation, so getting the grid-level emissions measurement right is the foundation for making those decisions well.
Why the same prompt can have multiple “correct” carbon footprints
For a single prompt, you can defend different answers without changing the model.
Take the physical electricity grid where a query is served. Using average U.S. grid emissions (347 grams per kWh), a median text prompt totals 0.082 grams of CO2. Vermont’s hydro-rich grid puts it near 0.006, while West Virginia’s coal-heavy grid puts it near 0.212, the 34x spread from earlier.
Even if the grid is held fixed, accounting alters your chatbot’s carbon intensity. Market-based accounting credits the clean electricity contracts a company has signed, which can bring the same prompt to 0.002 grams. Location-based emissions factors, which use averages based on the local grid, omit both these clean energy credits and on-site resources like gas. A data center using behind-the-meter gas (running its own on-site gas plant rather than connecting to the local grid) is about 0.12 grams.
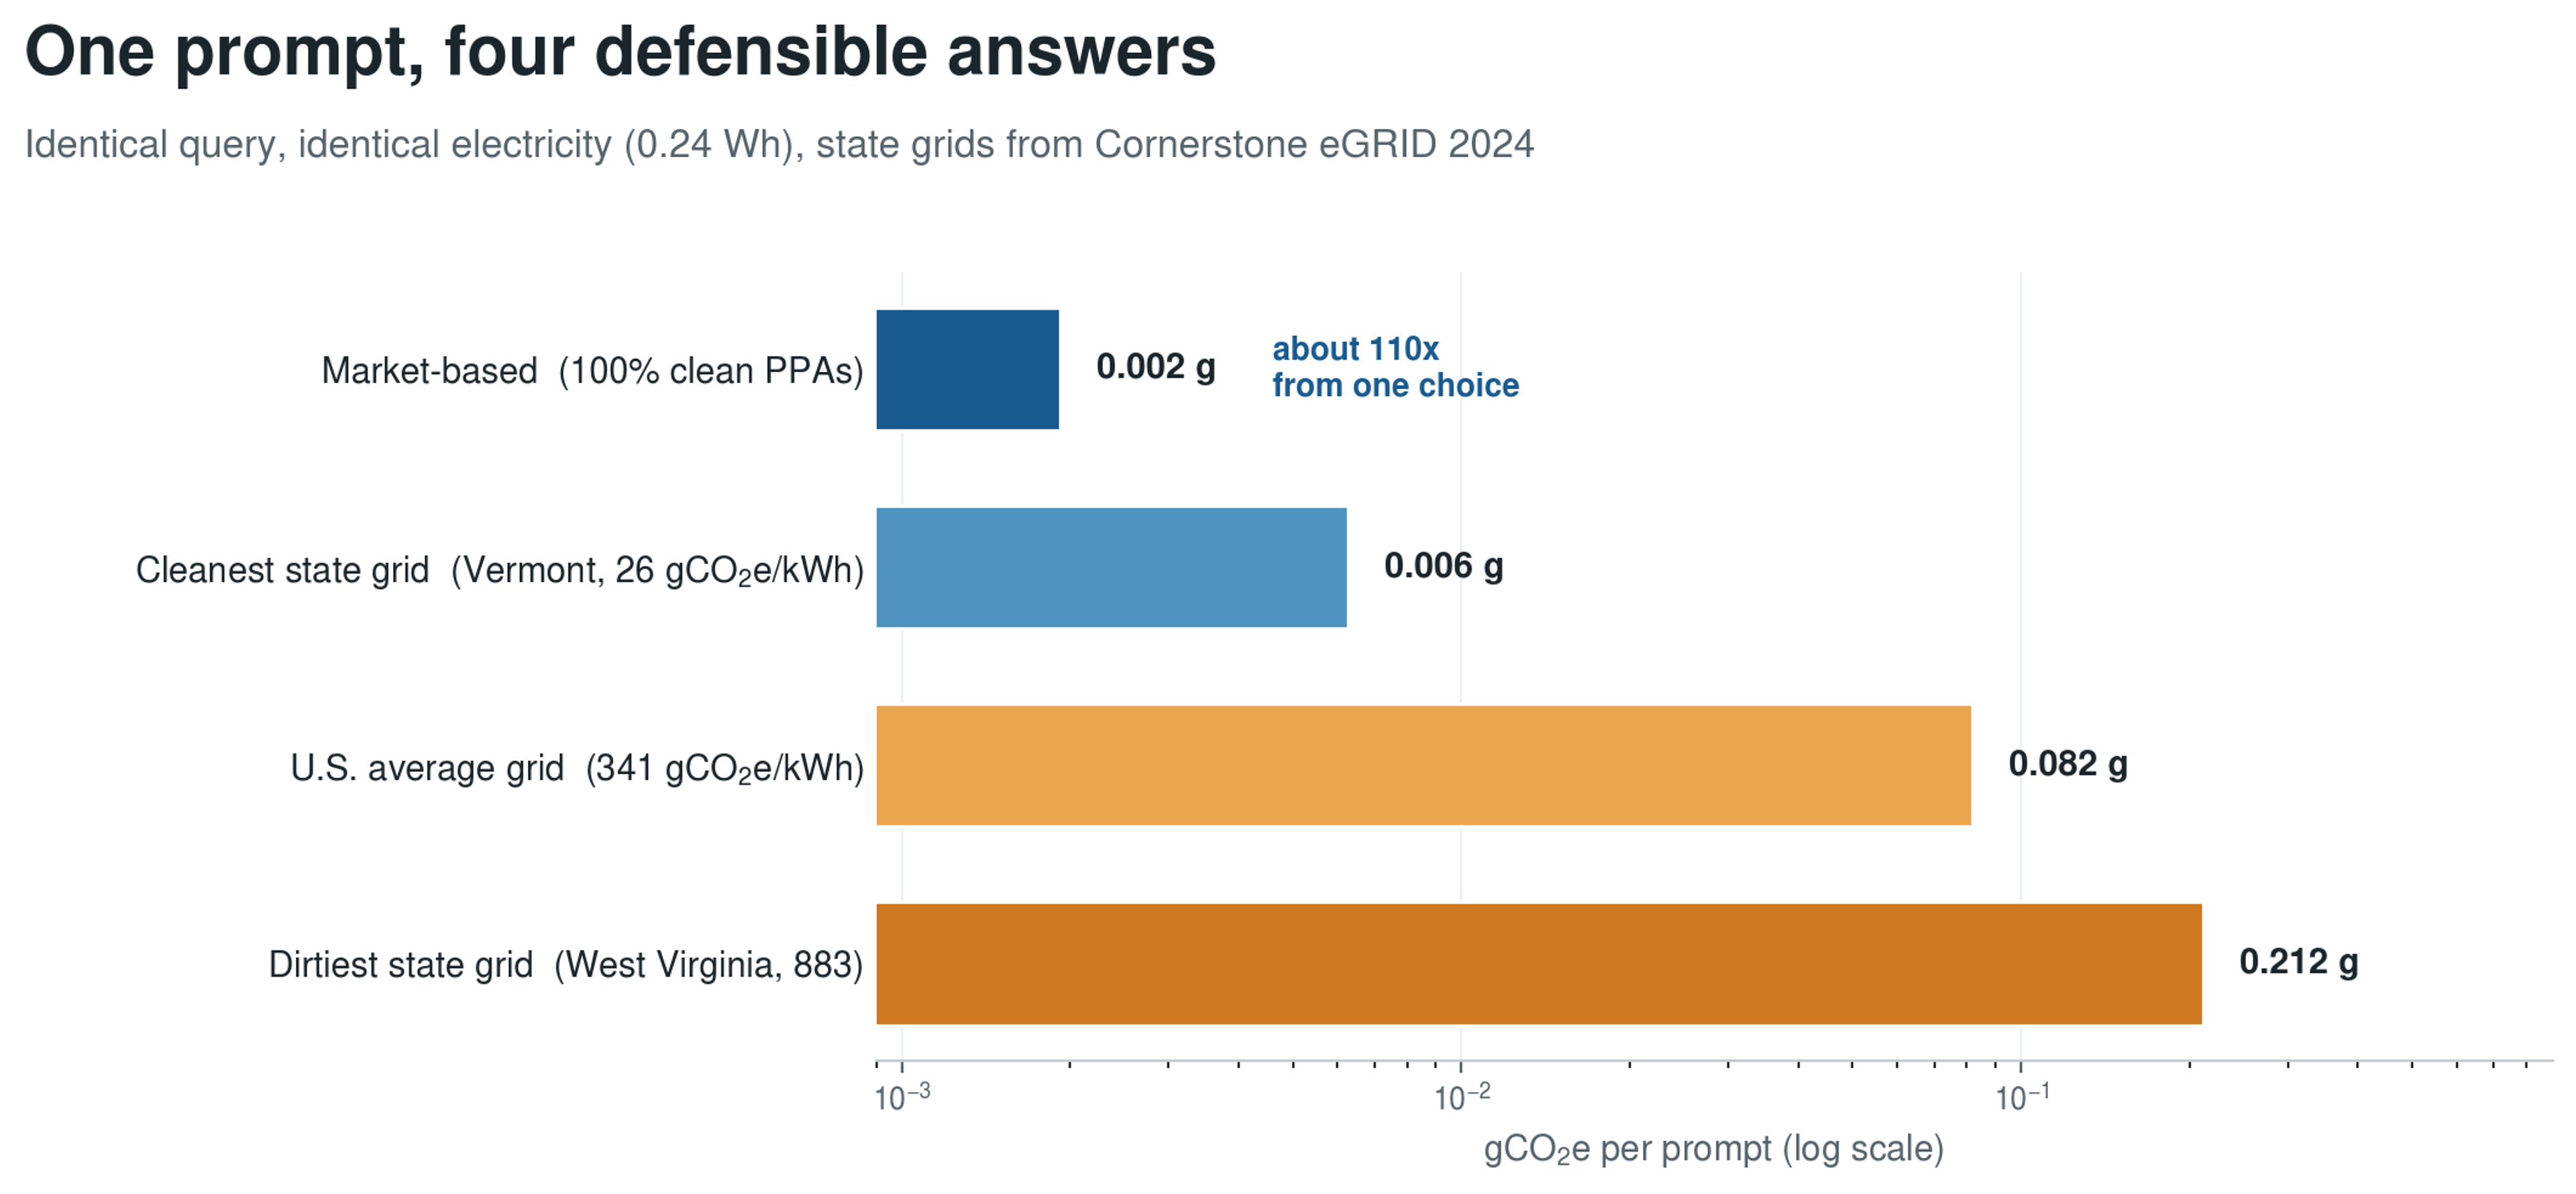
Every one of those numbers is “right” given its assumptions, yet they span a 100x range. These disagreements make comparability more important than a single figure.
The fix for this problem is shared reference data. Stakeholders need regional grid factors from the same transparent, up-to-date source, so grid assumptions are explicit and consistent.
That source is eGRID. Like a nutrition label for electricity, Cornerstone’s eGRID dataset tells you how clean or dirty each region’s power is. This dataset is an indispensable resource for calculating AI emissions, carbon savings from electric vehicles and heat pumps, avoided emissions from energy efficiency, and assembling your company’s emissions inventory. Watershed’s open framework for AI emissions is built on this logic.
This essential dataset nearly went dark
For two decades, eGRID was the EPA database that gave stakeholders essential data for their carbon accounting. Then EPA stopped updating the database in 2025, which meant that the most important input to a fast-growing part of the world’s carbon math was about to disappear.
The Cornerstone initiative picked it up—a collaboration between Watershed, Stanford, and ERG—and took over maintenance of eGRID. Now it is open, current, and maintained by people determined to keep it that way. The numbers above come from Cornerstone’s free eGRID 2024 release.
What can you do?
The good news is that this is measurable, and measurement points to action. Watershed’s framework is intentionally built so that measuring AI emissions is a conduit to reducing them. Start by measuring at the tier your data supports, and report emissions alongside electricity, which allows you to separate model improvements from a cleaner grid.
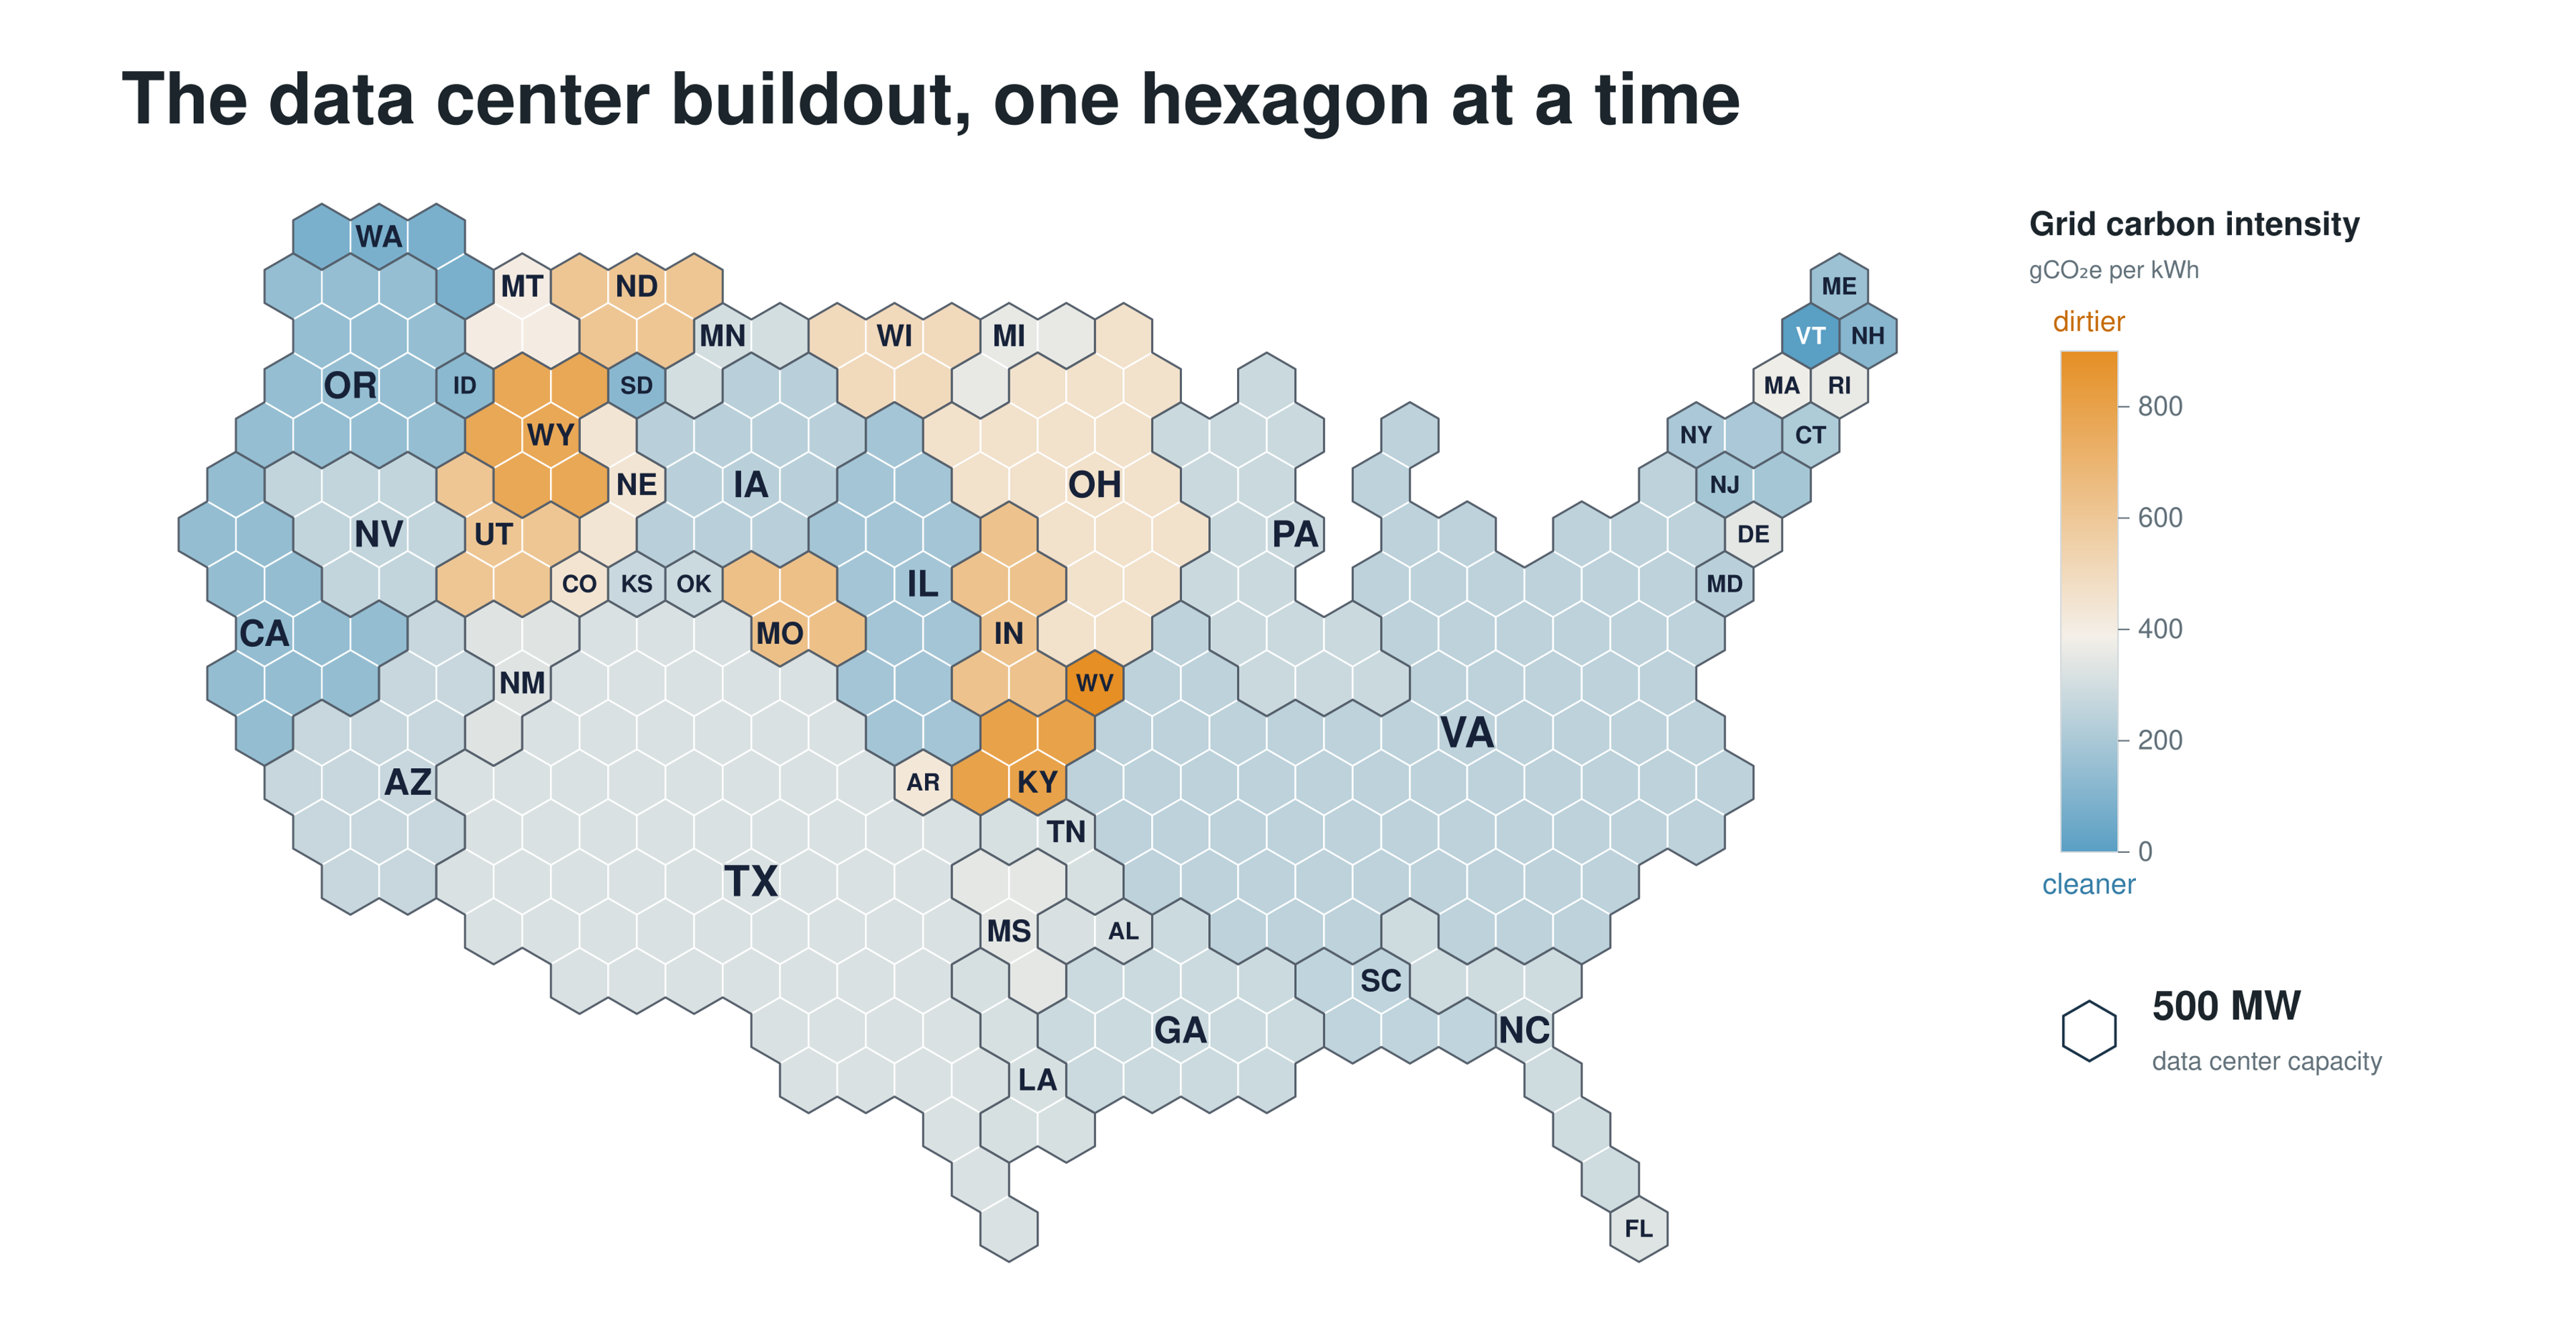
Measurement gives you two numbers. Reduction gives you two different levers. Electricity per task can be cut through prompt design and model routing, because a reasoning model can draw roughly 30 times the electricity of a smaller one. Carbon can be reduced through region selection and clean energy matching.
The biggest leverage is with the companies siting and routing the compute and the policymakers influencing the grid. Keeping open, current data like eGRID alive is how the rest of us hold both to account.
When quoting an AI carbon number, it is important to ask:
- Where it ran: Carbon intensity of individual grids can vary by orders of magnitude across regions.
- How it was counted: Any per-prompt or per-token number without a stated grid method is incomplete.
- Where the factor came from: Pull grid emissions factors from transparent, open-source estimates so that numbers can be verified.
Your prompt really is cleaner in Seattle than in St. Louis, and now you can see why. The path to trusted AI carbon estimates runs through open, current grid data. The same prompt with a different ZIP code can have different carbon and, at last, a shared way to tell the difference.