

Overview
At Watershed, we run a lot of data pipelines — when calculating customer footprints, for example. DuckDB is one of the core technologies powering our pipelines. Over the past 6 months, we’ve been able to achieve a 25% reduction in DuckDB compute spend while maintaining 95%+ footprint generation success rates amidst increased product usage.
Why DuckDB?
DuckDB is an in-process analytical query engine. It’s optimized for running complex joins and aggregations and is particularly performant for small-to-medium sized data that can be processed on a single machine.
We started using DuckDB in 2022, in order to make running analytical queries on footprints faster in our BI product. Using DuckDB gave us significant speedups — queries that took tens of seconds on Postgres now run in hundreds of milliseconds.
In addition to using DuckDB for analytical queries, we also use it for running our data transforms. The reasons we do so are:
- The data fits on a single machine: the vast majority of our footprints are under 100GB in size (uncompressed).
- Using a single query engine reduces operational complexity. Developers only need to be familiar with a single SQL dialect.
- DuckDB’s in-process architecture makes local development and testing easy. There’s no need for complex cluster management, and we’re able to write unit tests that actually run DuckDB.
Architecture
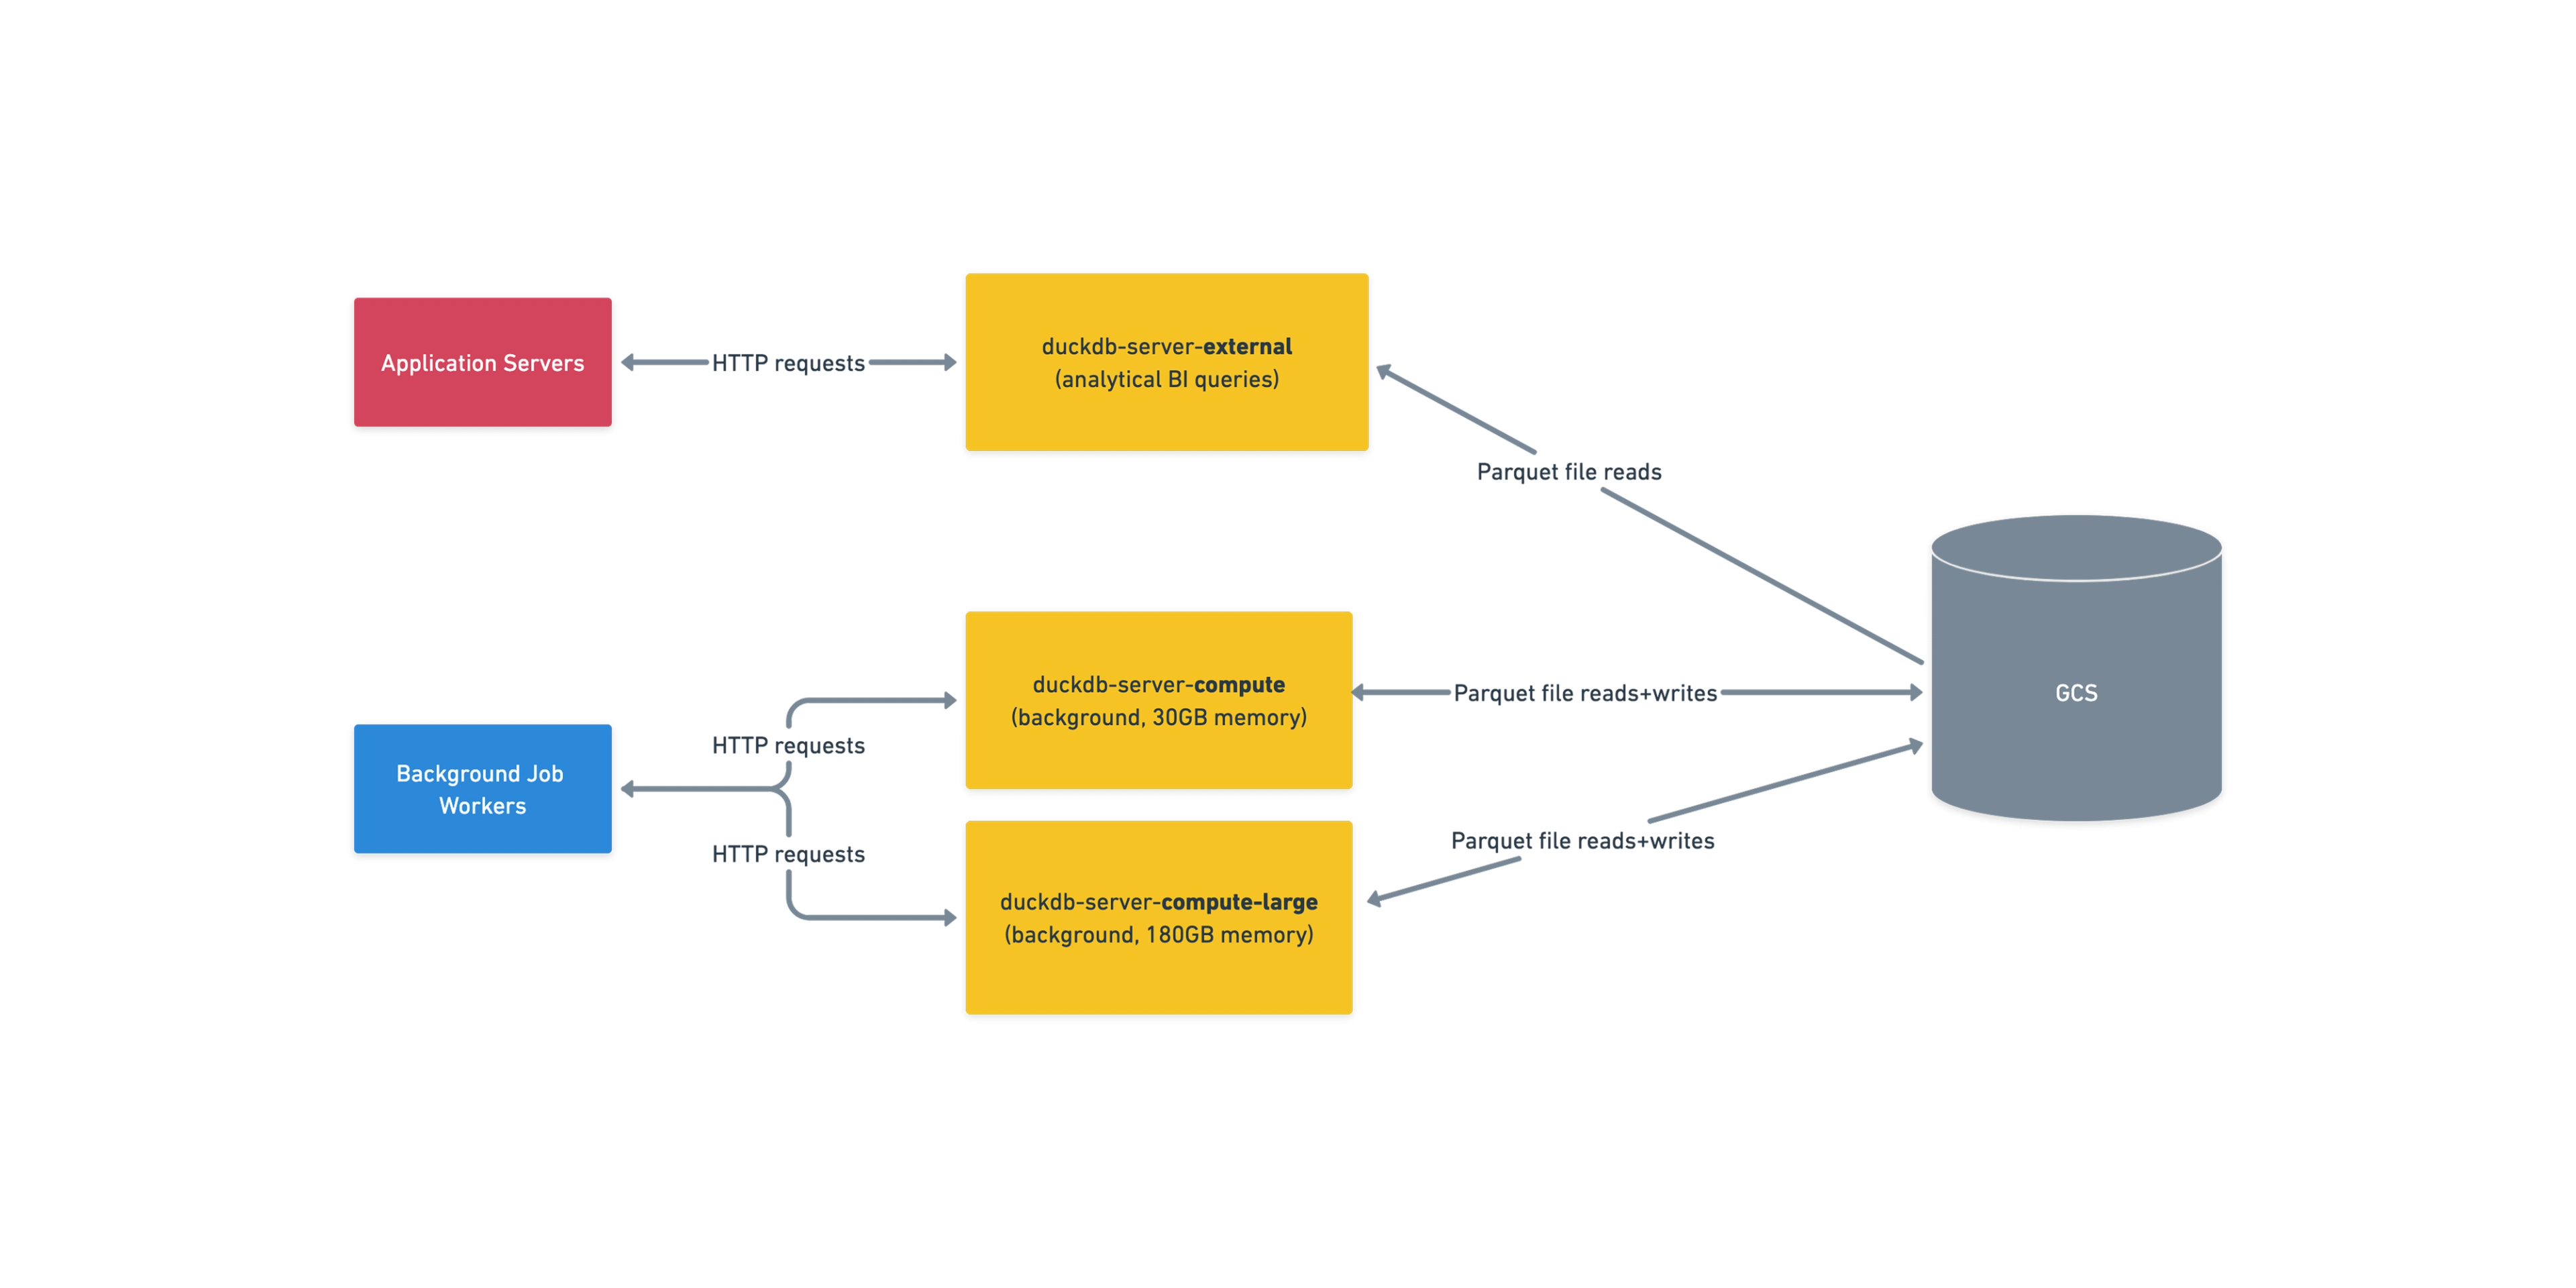
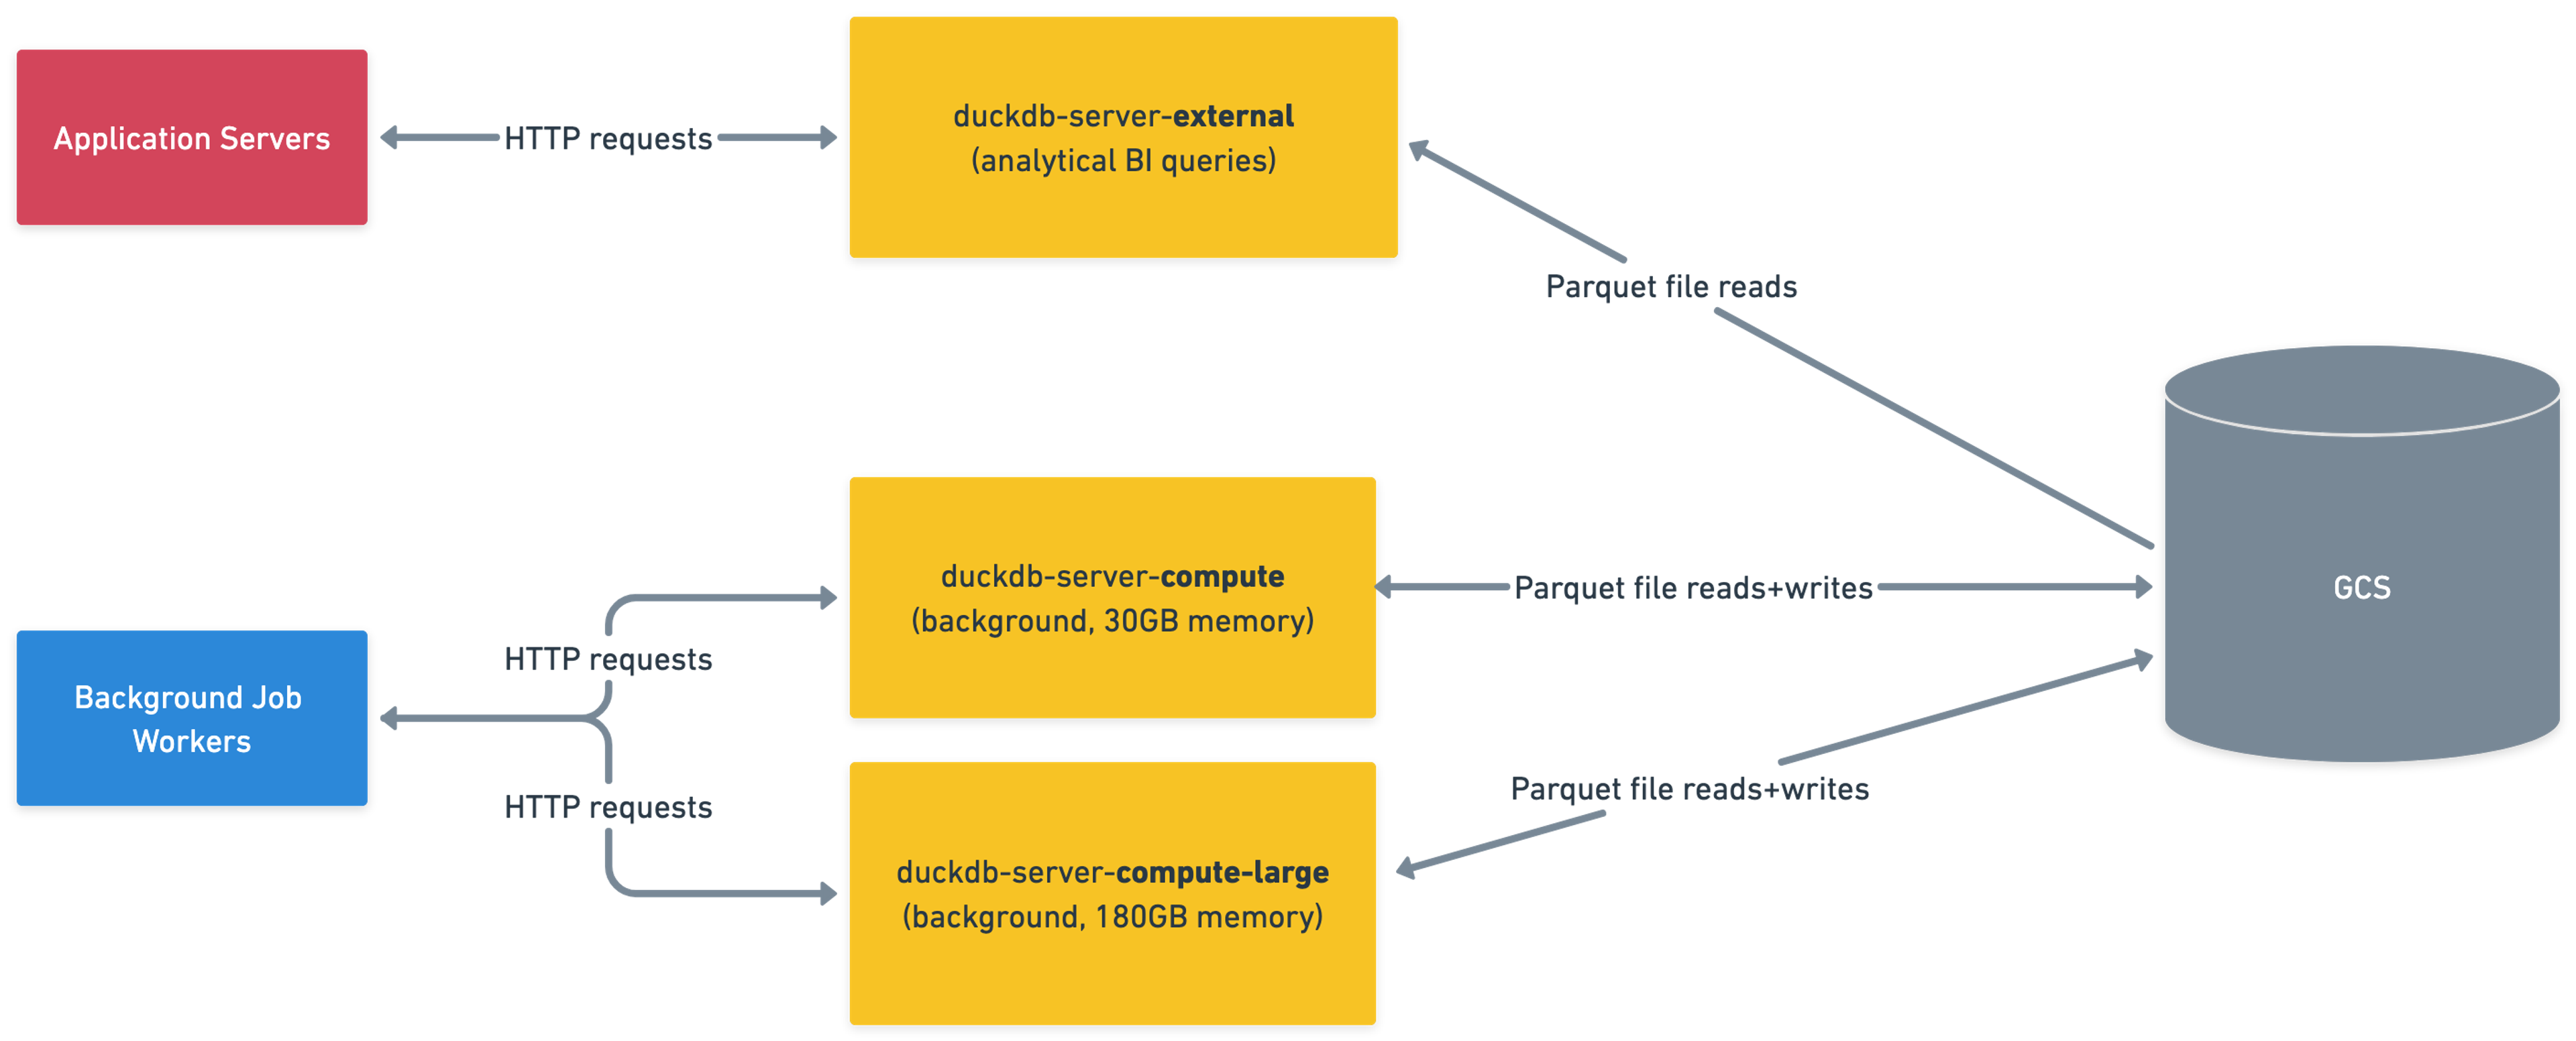
In order to isolate application servers from memory-hungry DuckDB processes, we run a separate deployment of duckdb-server services. There are a variety of services tuned for different execution profiles, such as background jobs versus real-time queries. Each service is a deployment of multiple machines, and on each machine we run one or more DuckDB processes.
Clients send requests indicating the SQL they want to run and the data they want to run it on, and duckdb-server handles downloading the data from Google Cloud Storage (including caching for frequently used files), running queries, and then either returning results over the wire or writing them back to GCS.
We serve over 100k DuckDB requests per day, with latencies ranging from milliseconds to upwards of 30 minutes for our longest transformation steps.
The problem
Going into 2025, we’d been operating DuckDB successfully in production for several years, but there were a few issues we knew we needed to get ahead of:
- Out-of-memory (OOM) errors were becoming more frequent as customer data size and methodological complexity both increased.
- To resolve OOMs, we relied on manually scaling up for certain customers. This was often done reactively after errors occurred, and contributed to oncall burden.
- Measurement season 2025 was fast approaching. Each new year, we get a surge in traffic due to customers calculating footprints for the previous calendar year. Continuing with the manual approach was unsustainable and would have led to an unacceptable level of footprint generation errors as traffic increased.
Technical details
During footprint generation, the vast majority of DuckDB requests are what we consider low memory (<30GB) and fast (<60s). A smaller subset of requests are the exact opposite: slow (>120s) and high memory (~160GB). To accommodate requests with distinct resource profiles, we use different variants of duckdb-server with different resource limits. duckdb-server-compute has 30GB of memory available for each DuckDB process, while duckdb-server-compute-large has 180GB.
Naturally, we want to serve as many customers as possible on smaller machines, for cost efficiency purposes. For a long time nearly all customers could be served on these smaller machines, and duckdb-server-compute-large was just an escape hatch that we manually opted large customers into via a feature flag. When we only had a few customers with large data, this was ok.
Over time, however, the number of customers that required duckdb-server-compute-large grew. By fall 2024, we had roughly 20 customers that required the flag. Keeping track of which customers would need the flag was an increasingly stressful and unsustainable process, as it became difficult to predict which customers would have large enough data to trigger errors. We often found ourselves reactively turning the flag on after customers ran into errors.
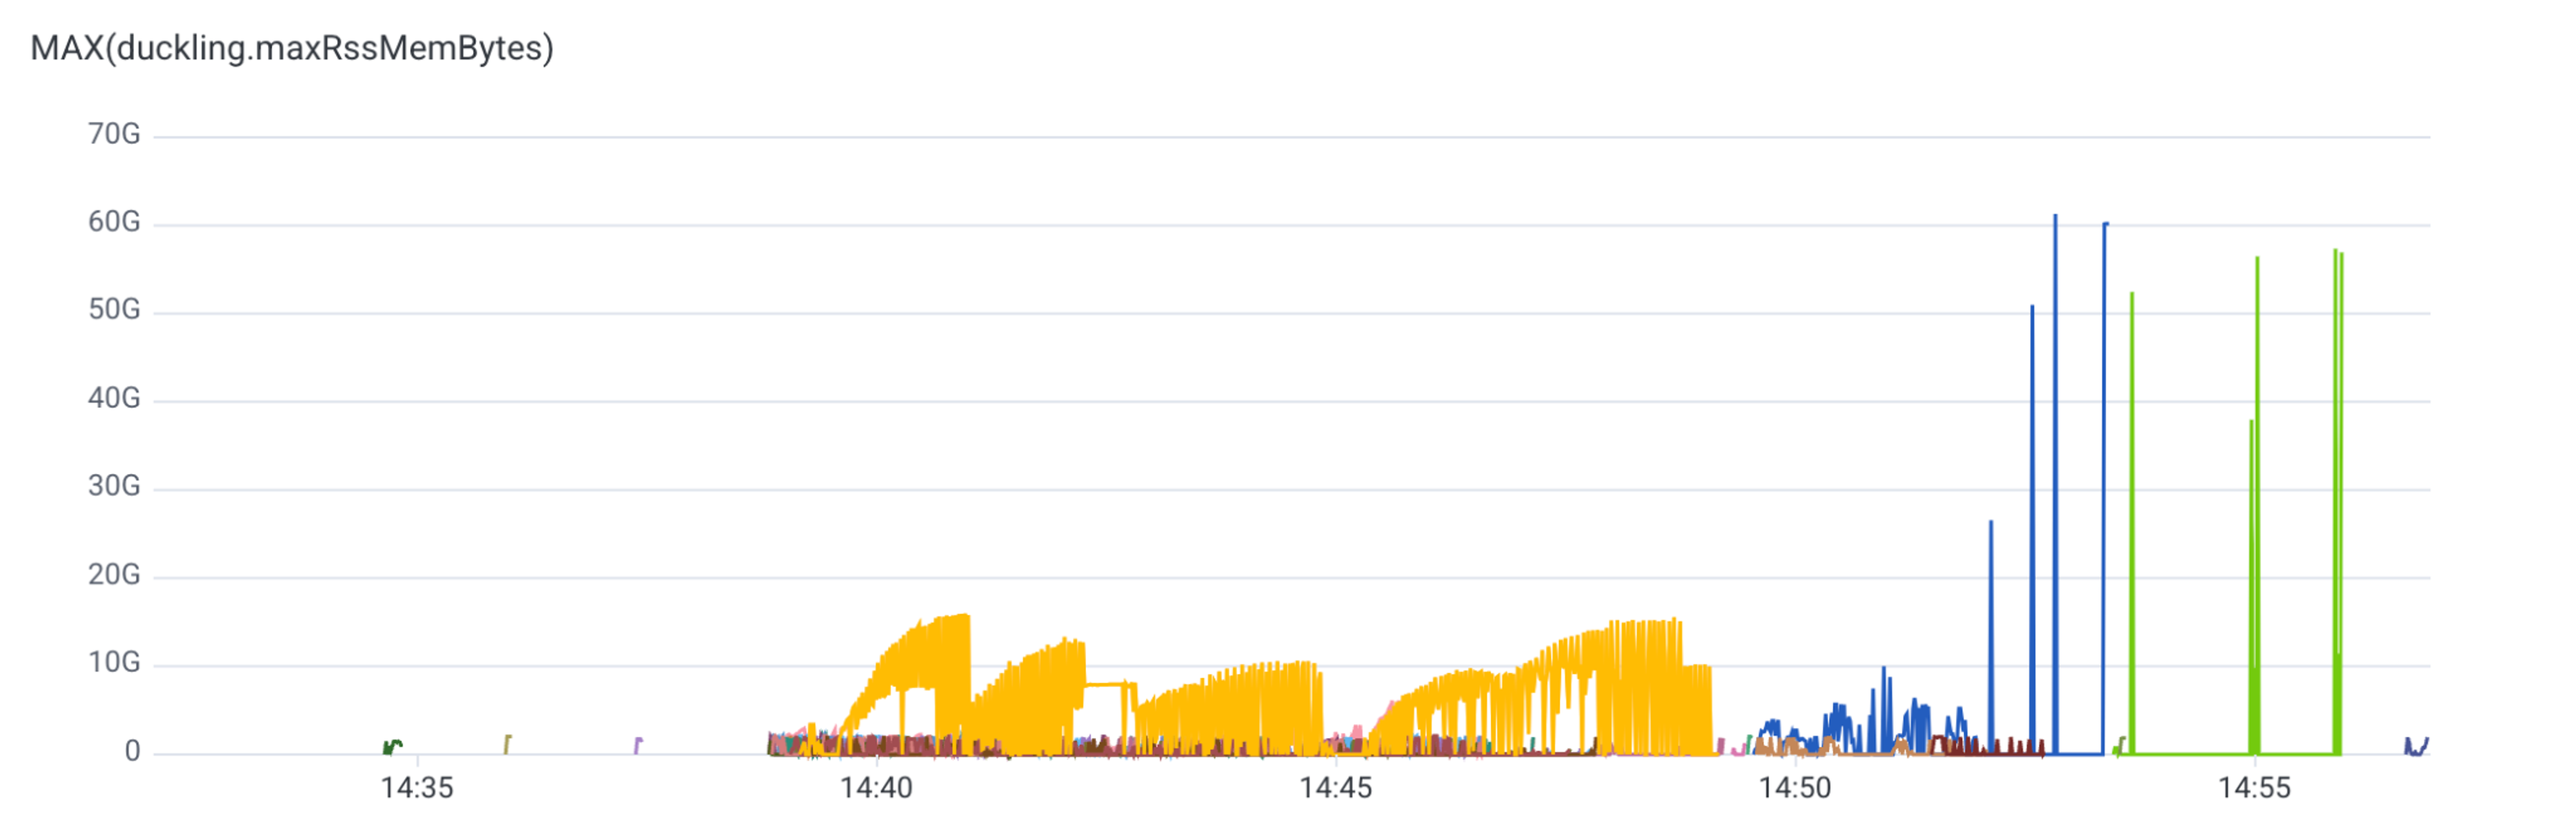
This was also becoming cost ineffective, because the flag sent all of a customer’s traffic to duckdb-server-compute-large, even when only a subset of traffic required the larger machines. Below is a graph of DuckDB memory usage during an typical footprint generation run. The majority of requests use less than 30GB, and it’s only the final few requests that are more expensive. This is because most of footprint generation runs on smaller shards of the data (e.g. one per activity dataset), and it’s only at the end when we merge the results into the overall footprint that we deal with larger data sizes.
The solution
We knew that a customer-level flag was not a sufficient solution to our request routing problem. Instead, we needed a way to send each request to the correctly sized machine automatically.
Our solution was Resource Estimation. Resource Estimation allows authors of requests to DuckDB (our product engineering teams) to specify estimates for how resource-intensive their requests will be. And we use that estimation to appropriately route to our various machines.
To roll this out, we worked with our product engineering teams to analyze requests and identify thresholds for when to consider requests “large.” In the simplest cases, it was apparent how to set thresholds:
- Lightweight queries like
SELECT COUNT(*) FROM xcould always be considered small, since they never consumed much memory even on large datasets. - In other cases, there was a clear correlation between input data size and memory usage, and it was easy to set a threshold based on input data row counts.
For other requests, however, the analysis was more complicated and required increased consideration of the different variables which could determine the complexity of a query. For example, when we compute emissions for a given subset of customer data, the SQL that gets run is generated on the fly, depending on the calculation methodology being used. In these cases, we added observability and then analyzed the data to identify suitable logic for setting thresholds.
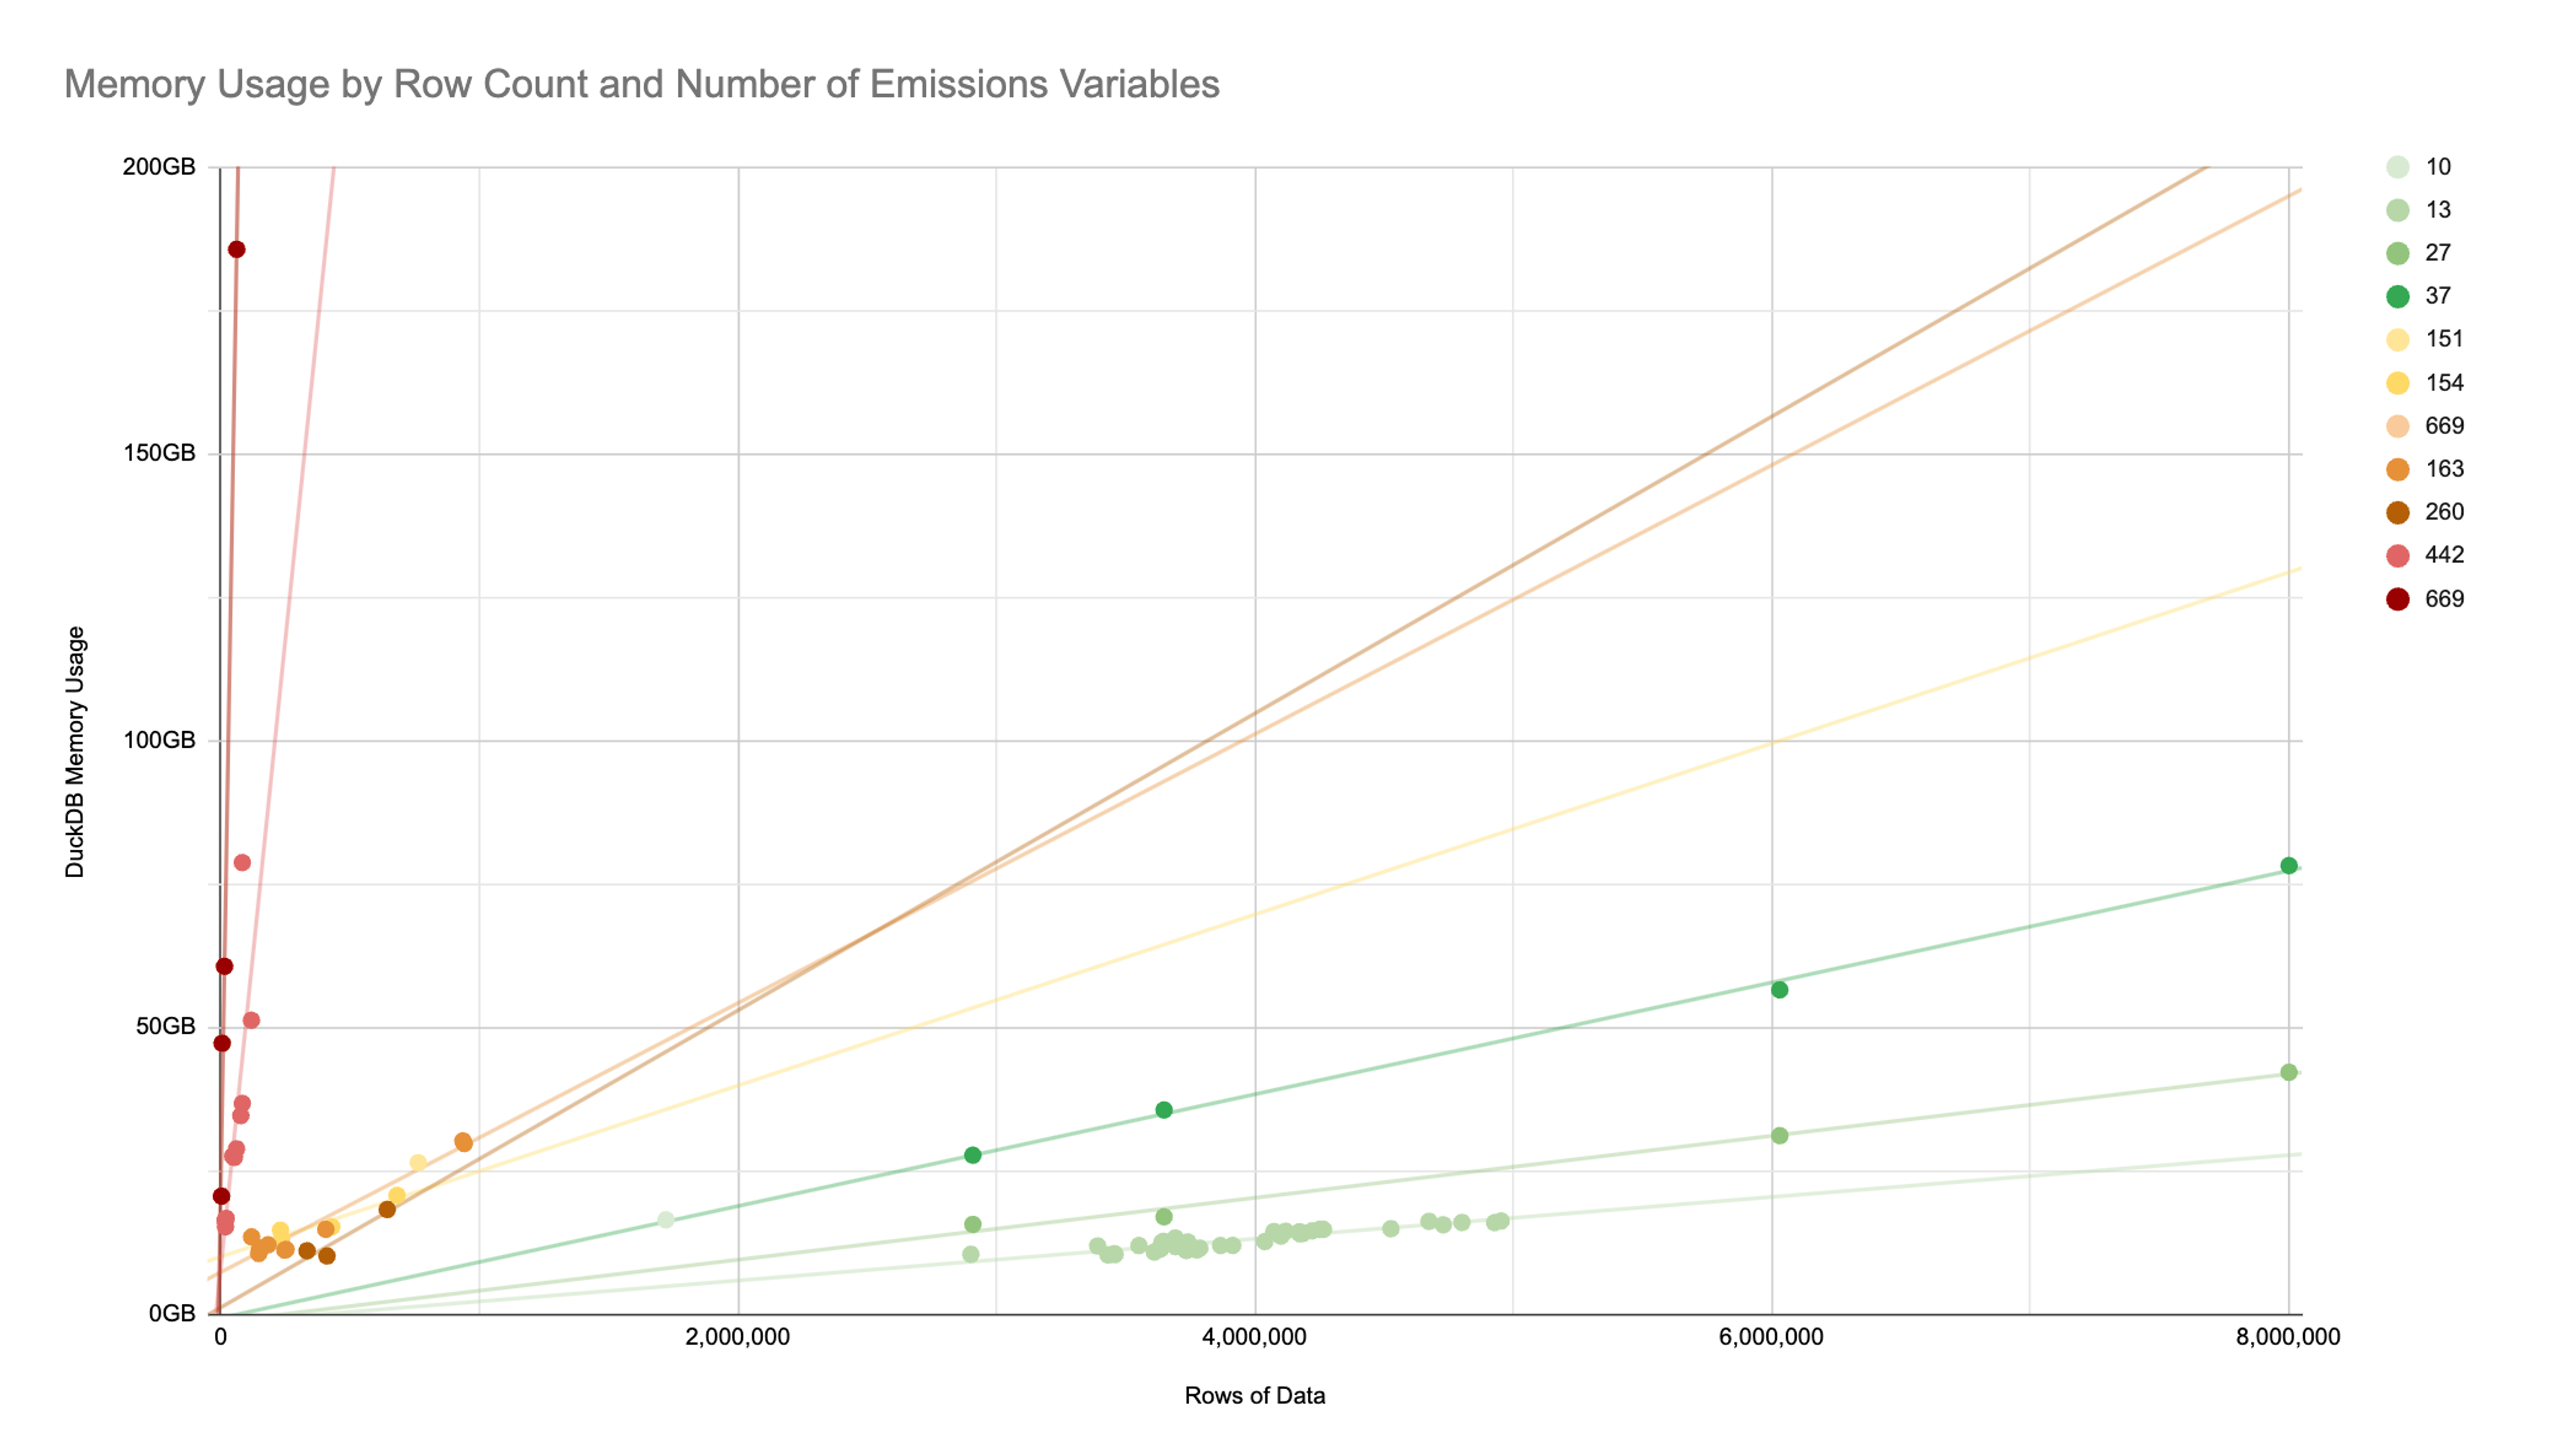
The graph below shows memory usage for emissions calculations plotted against input dataset size. There’s not an apparent trend just looking at data size, but grouping by the number of complexity of the methodology tells a different story. You can see that data must be both large and run on complex methodology before it warrants larger resources.
We worked closely with the Footprint Calculation team to add resource estimation thresholds in advance of measurement season, and were able to enable it for all DuckDB requests used in footprint generation.
Results
This measurement season, we’ve generated twice as many customer footprints as last year. Thanks to Resource Estimation, we were able to do so while keeping costs and error rates down, achieving the following:
- Due to more effective utilization, we were able to decrease the number of
duckdb-server-compute-largemachines required to serve traffic. This, combined with autoscaling improvements, meant that we were able to achieve a 25% cost reduction compared to our late 2024 baseline. - We’ve prevented errors during measurement season — requests that otherwise would have errored were instead automatically routed to
duckdb-server-compute-large. Customer footprints succeed on the first try rather than requiring manual intervention, and our OOM and footprint generation error rates stayed low. - Product engineering teams have a better understanding of DuckDB. Instead of thinking of DuckDB as a black box, we’ve empowered our product teams to analyze the performance of their queries, understand the memory intensiveness of their requests, and even write more efficient SQL, which benefits both our infrastructure and the end-user experience.