
At Watershed, our mission is to help organizations take meaningful actions against climate change. To do this, we combine customer data with high-quality climate data. Climate data includes datapoints like the greenhouse gas (GHG) emission intensity from power generation, refrigerants leakage, and agricultural activities. It captures the source and magnitude of emissions from physical, real-world processes.
Watershed customers rely on climate data for regulatory reports and business decision-making. This data also acts as the core building blocks for the next generation of AI and ML applications in sustainability. However, high-quality climate data has often bottlenecked progress in the corporate carbon accounting space. This is because climate data doesn’t just appear, it’s built.
This past year, our team revisited how we develop and maintain one of the most widely used datasets in corporate carbon accounting: the Comprehensive Environmental Data Archive (CEDA). This post covers how we turned an academic dataset into a modern and scalable data product.
CEDA and the importance of foundational data
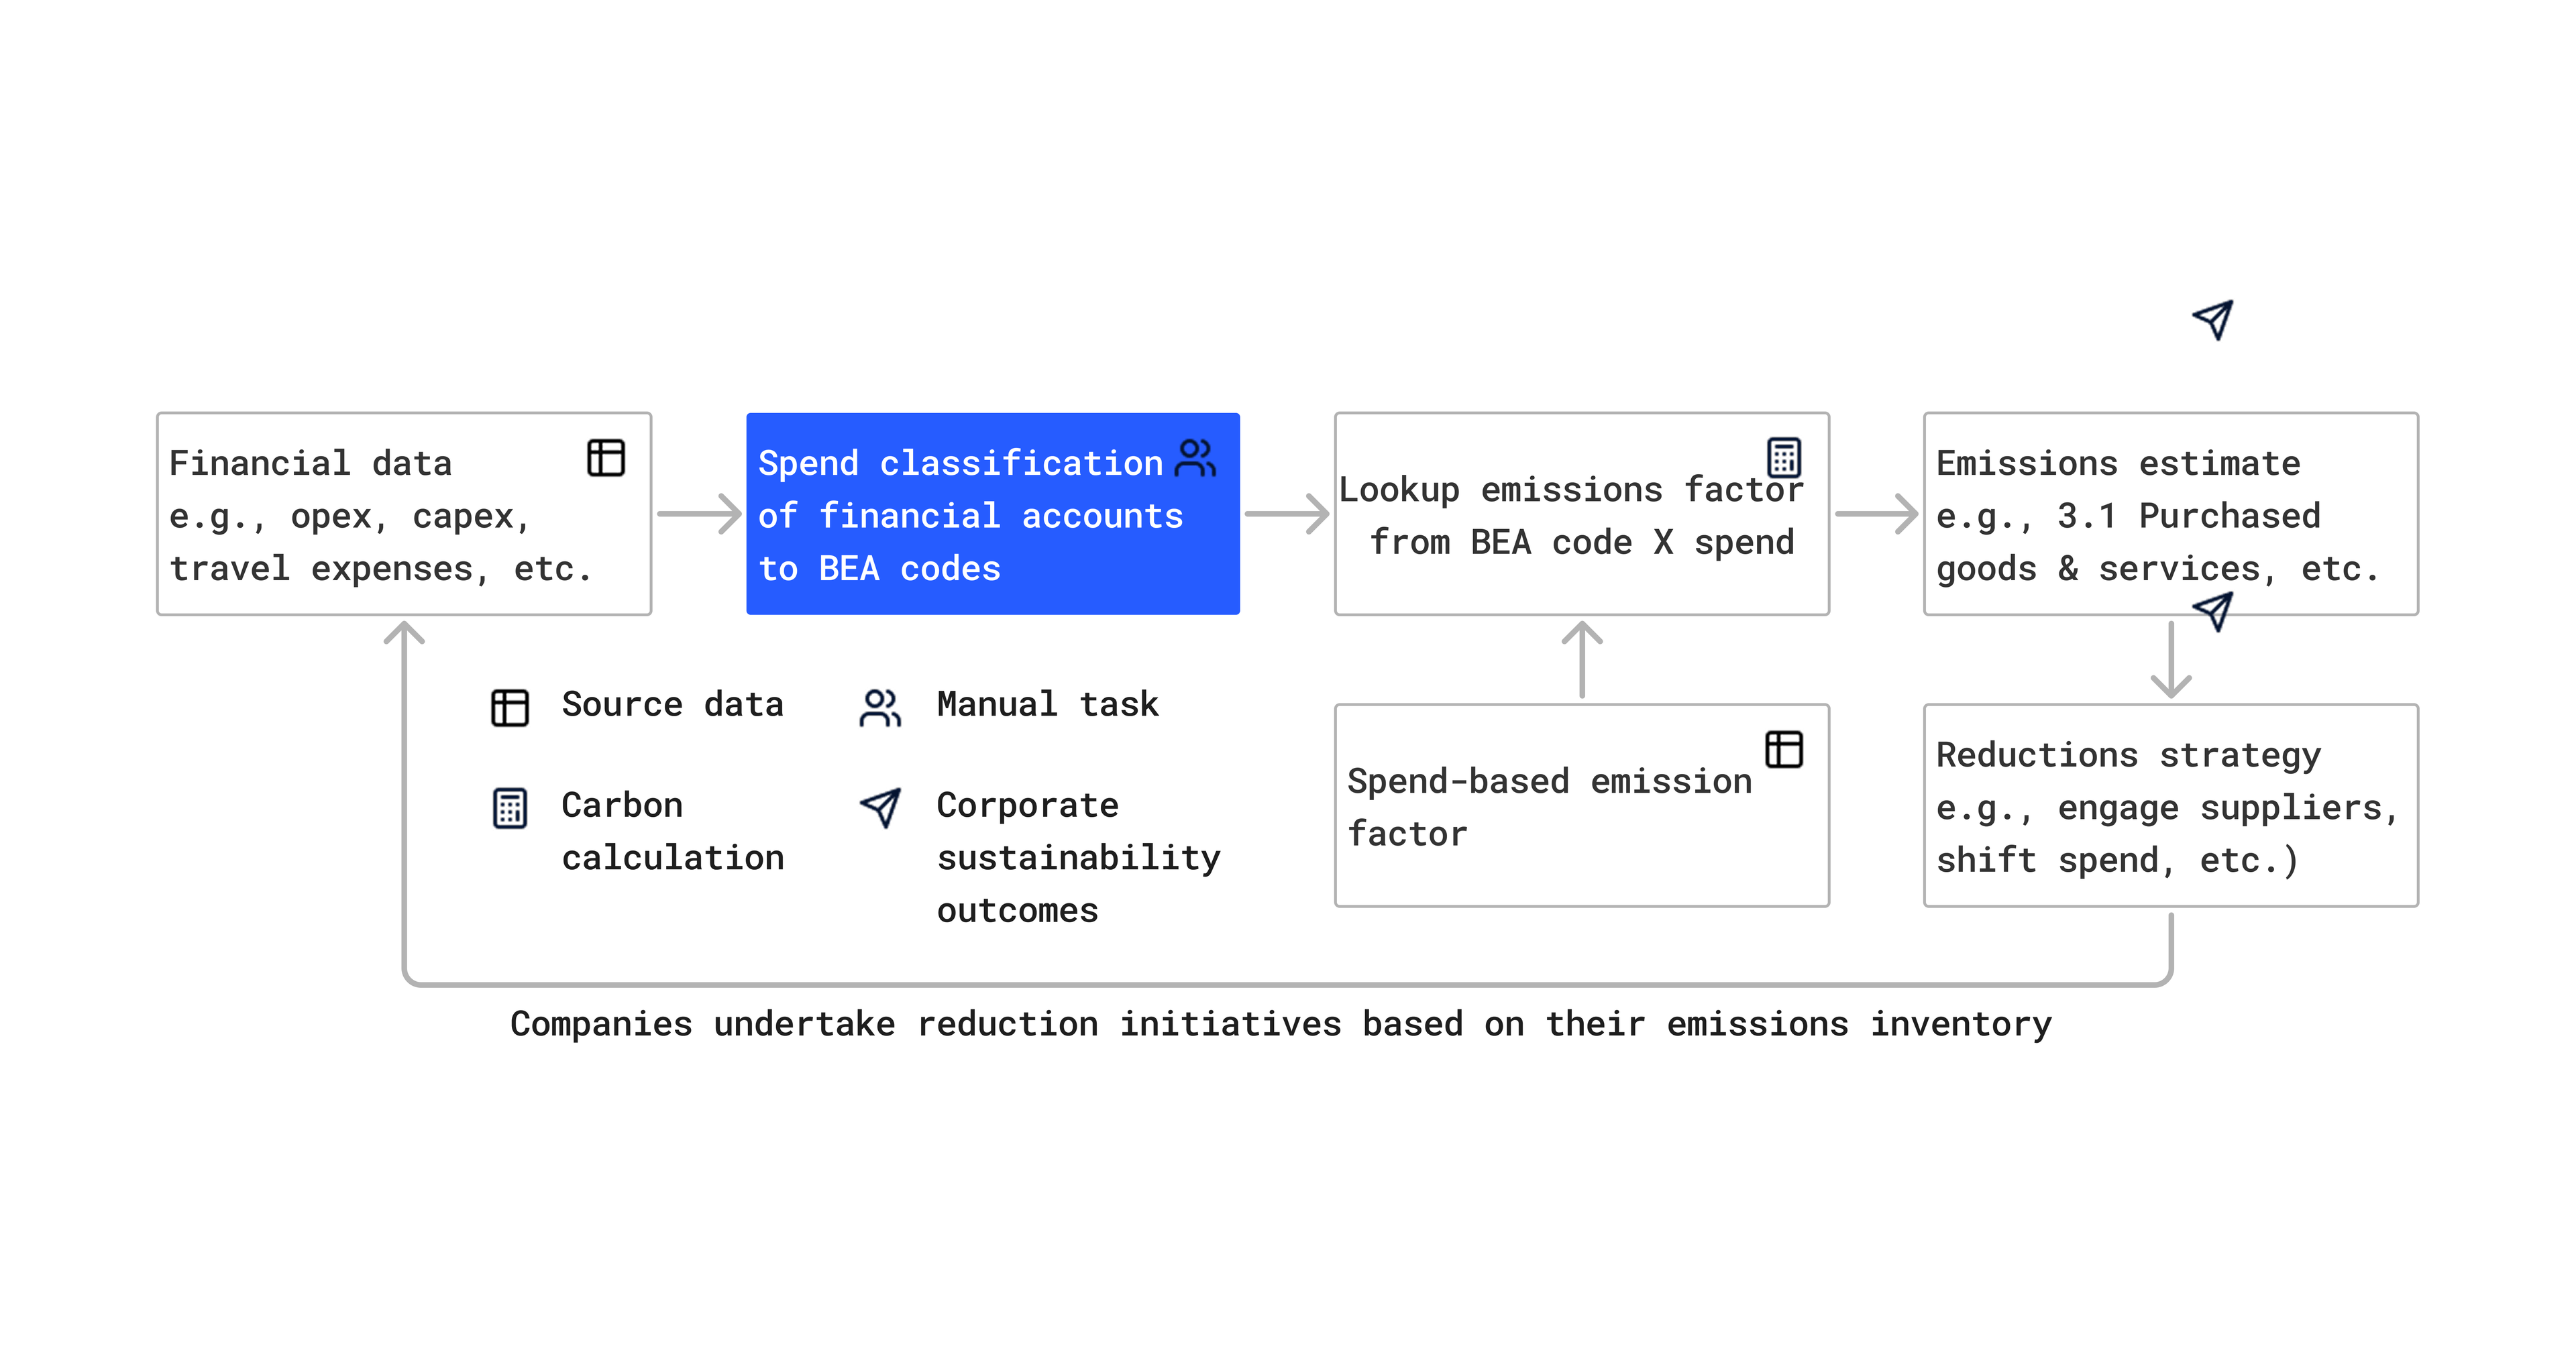
Before companies can cut emissions, they need to understand them. Supply chain decarbonization depends on accurate, transparent emissions factors, or carbon intensities, of goods and services produced and traded across the world.
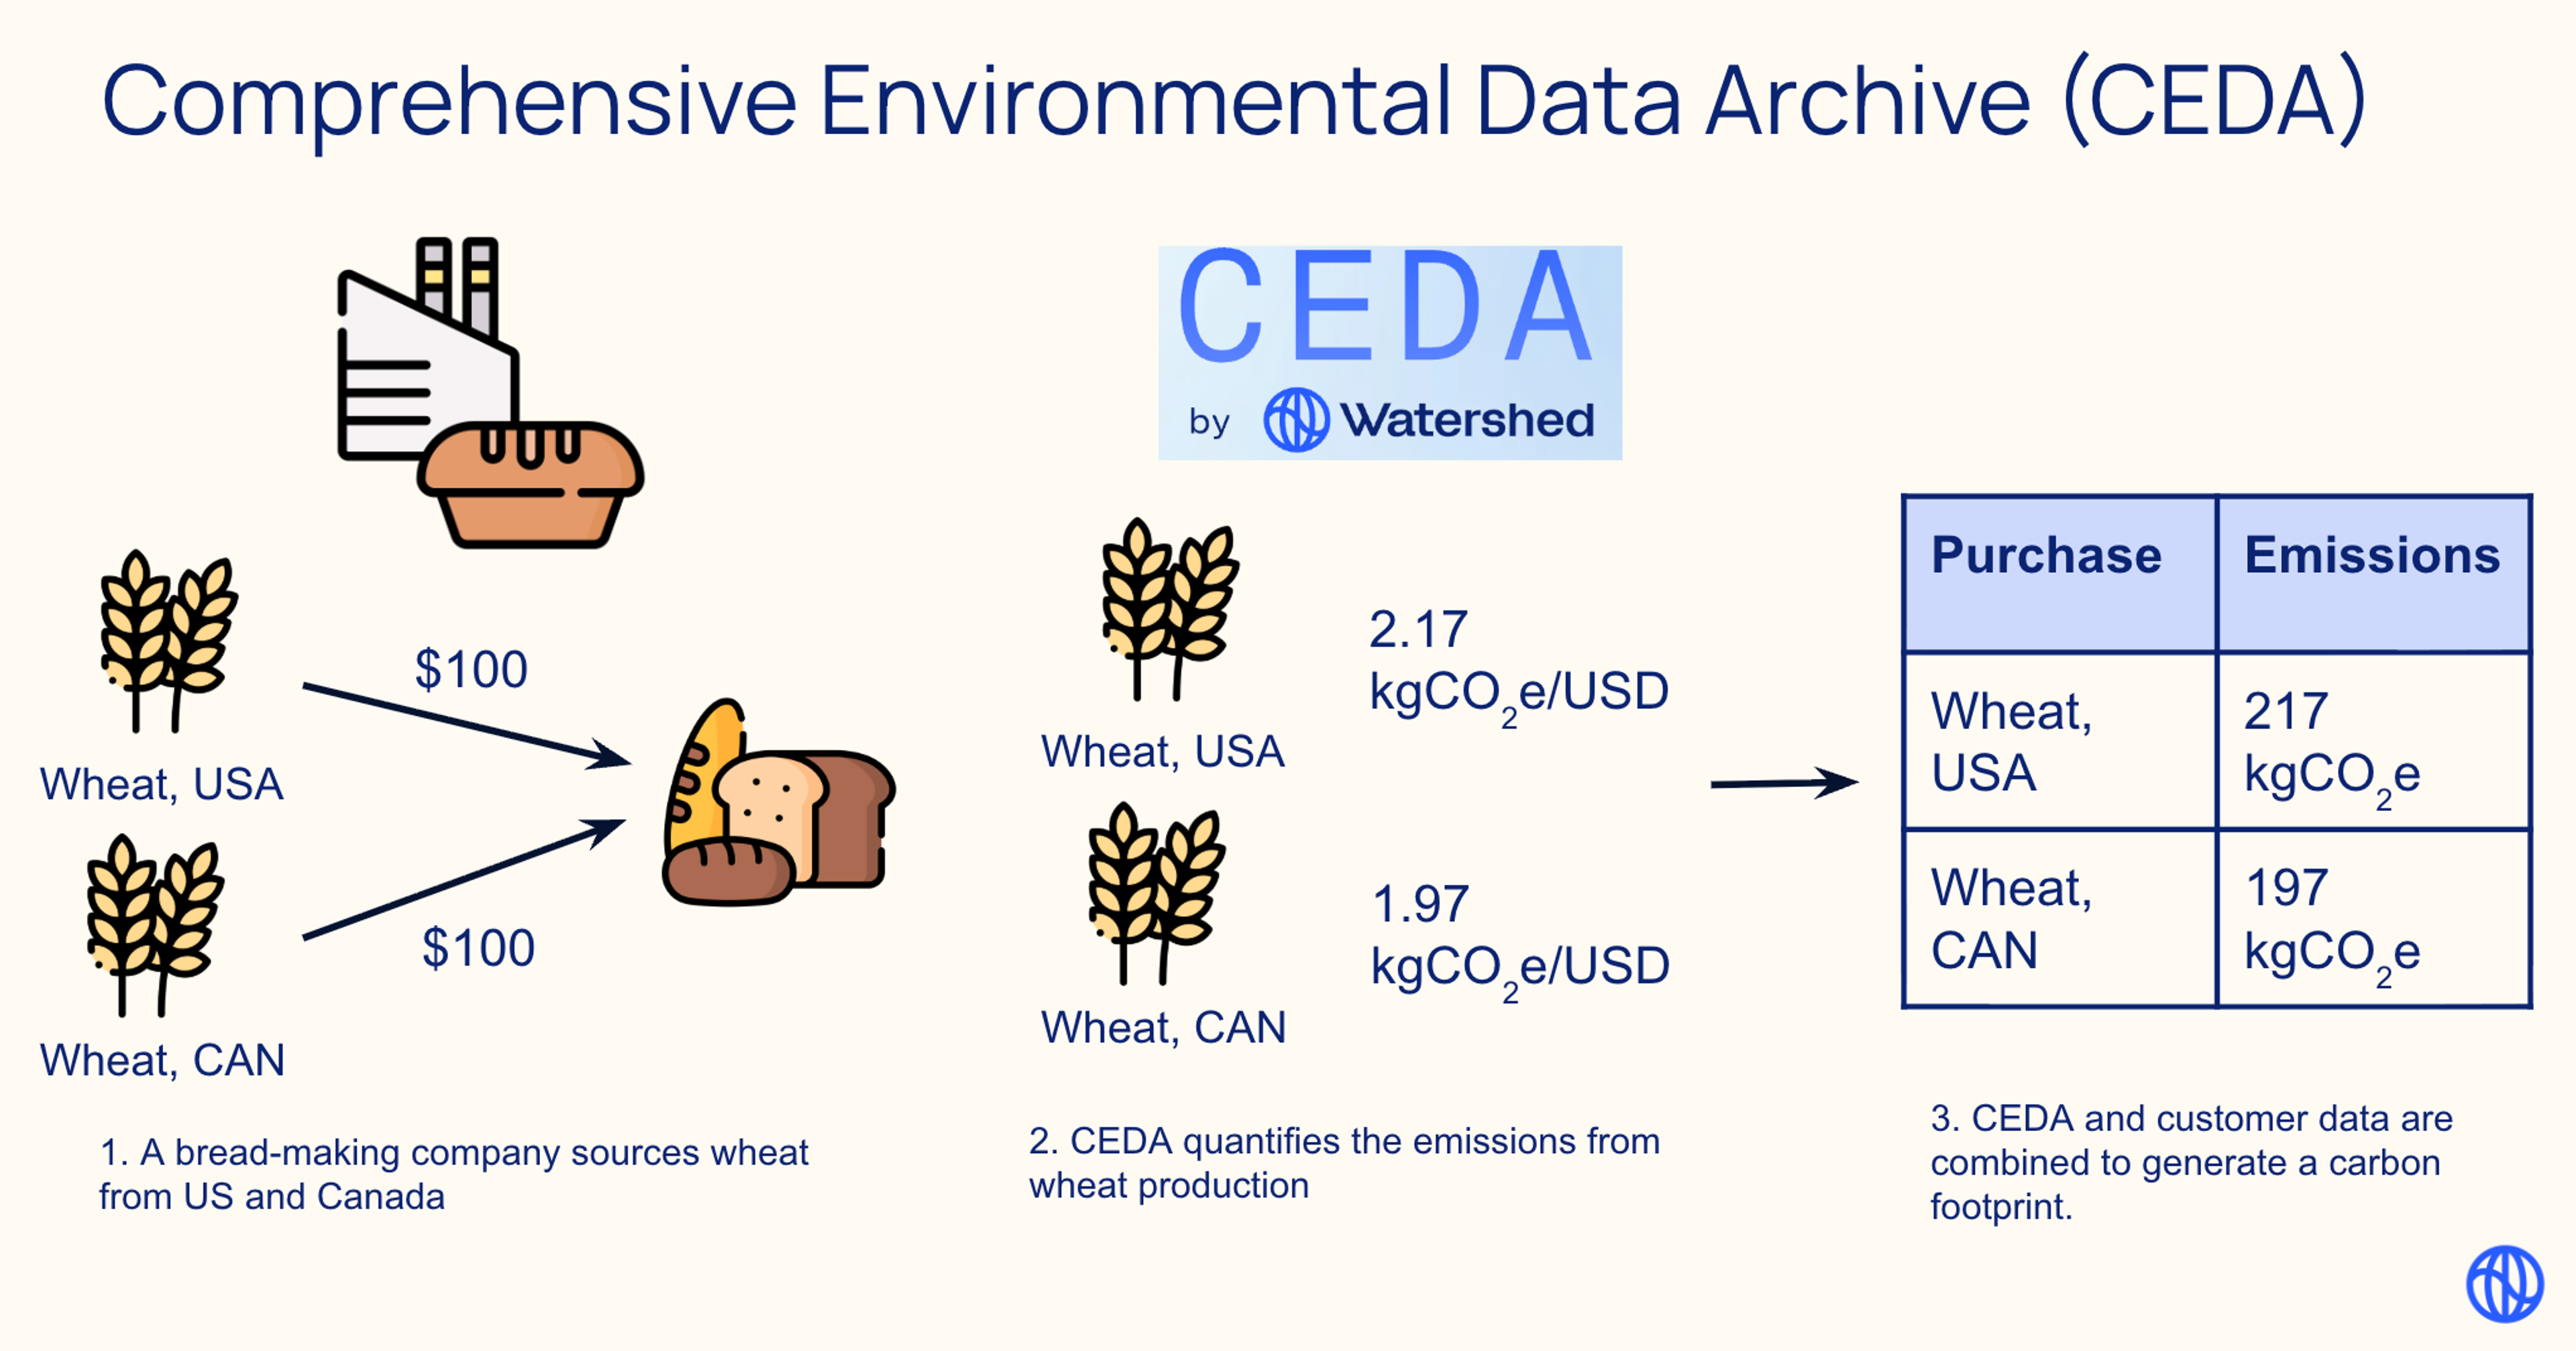
That’s what CEDA provides. With over two decades of research development, CEDA is a database of CO₂equivalent-per-dollar emissions factors. CEDA quantifies the production of 400 goods or services sourced from any of 148 countries (a total of 59,200 data points). It is used by 85% of Watershed customers to measure their Scope 3 supply chain emissions.
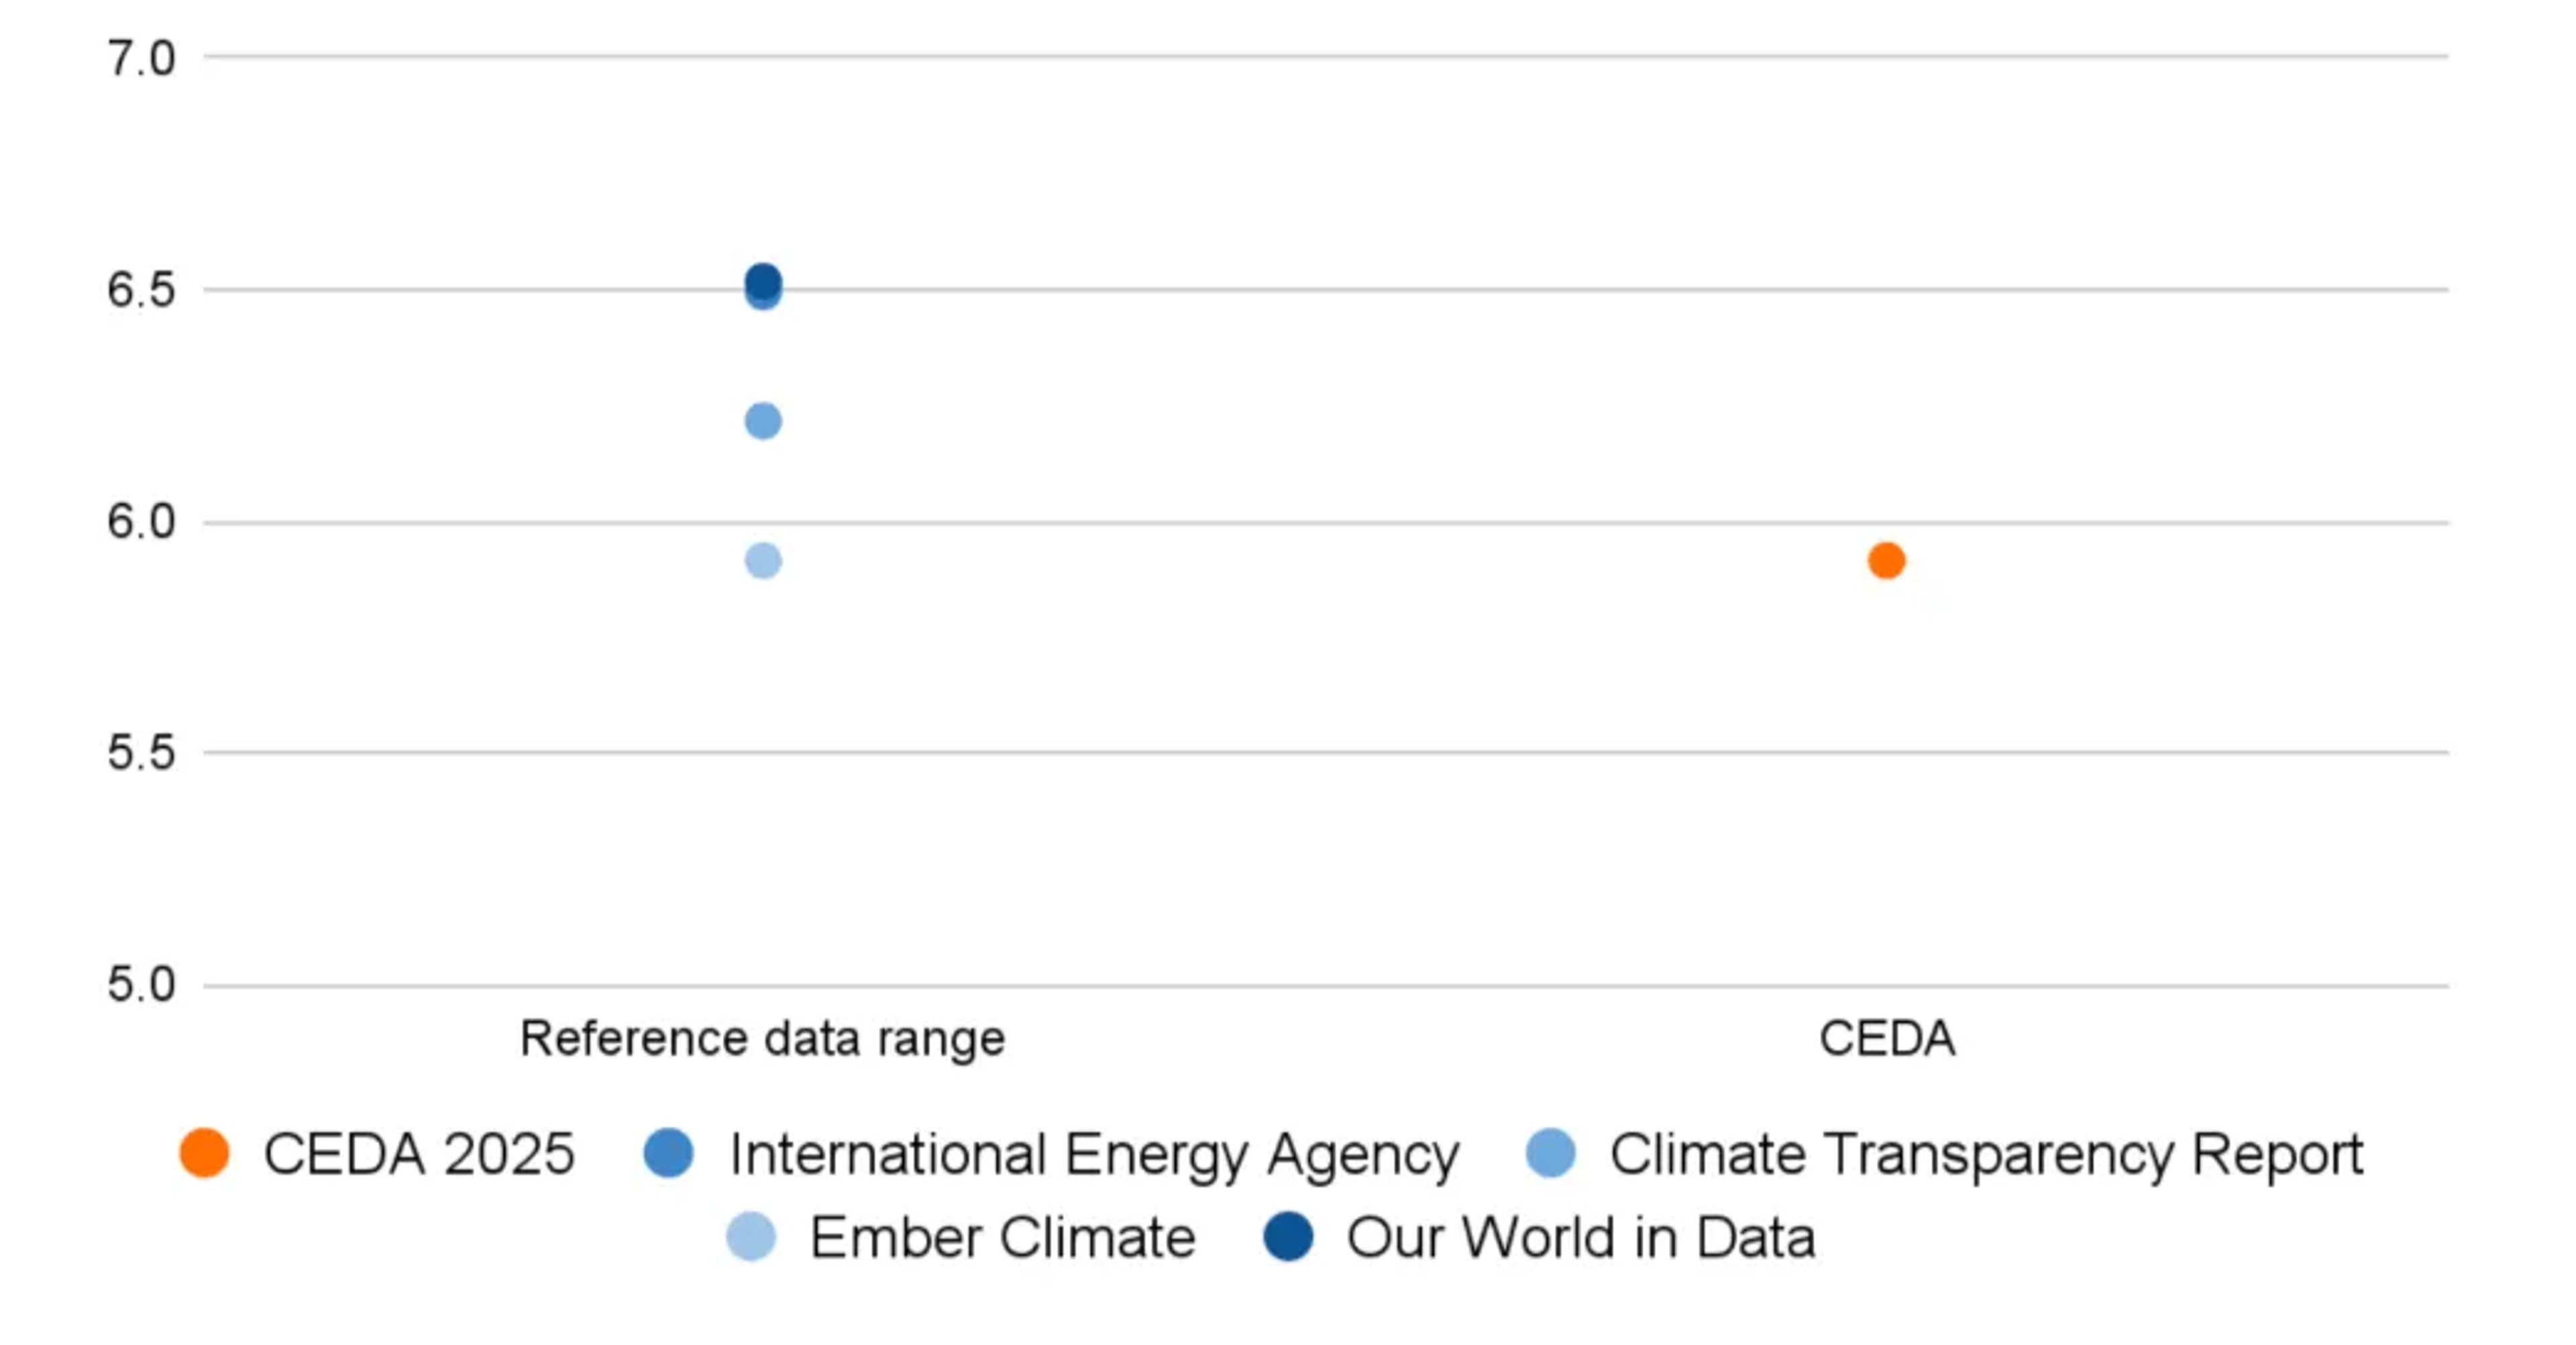
For example, a bread maker can use CEDA to understand the emission intensity of the wheat sourced from their suppliers: 2.17 kgCO₂e/USD from US, 1.97 kgCO₂e/USD from Canada. They can use this information to track their year-over-year emissions and inform a supply chain sustainability program. Even more powerfully, CEDA’s underlying framework, environmentally-extended input-output modeling, captures a full view of the global economy, allowing users to unpack their total emissions into hotspots by supply chain tiers and root emissions sources. In the case of bread makers, CEDA can justify their focus on the soil management initiatives of their direct suppliers.
CEDA is updated annually to track real-world decarbonization (the update is one of the main ships from the CEDA team at Watershed every year). This is demanded by customers, investors, and regulators who need carbon data that’s reliable, traceable, and up-to-date.
From research project to data product
CEDA’s history spans decades—from Dr. Sangwon Suh’s foundational research (2000–2005), through VitalMetrics’ stewardship (2005–2023), to its open-source transformation under Cornerstone Sustainability Data Initiative today.
But maintaining a widely used, global climate dataset isn’t the same as maintaining a research model. Combining over 20 datasets across various national and international data providers, CEDA’s data pipeline is complicated. Historically, database updates were infrequent, and customer scrutiny of emission intensity changes and their explanations was similarly low. Today, with over hundreds of companies and numerous standard-setting bodies such as CDP, SBTi, and PCAF using CEDA, the need for a reliable, reproducible, and well-tested data product is more than evident.
Out team especially felt this last year, when we overhauled a number of key CEDA data inputs and algorithms for our biggest release of CEDA to date. While this launch had fantastic user reception, our team exited the project with a long list of learnings about how CEDA development could be improved. Most notably, a single change to CEDA took a lot of toil and time: it was difficult to test, difficult to have confidence in, and difficult to review; but we needed to still do all of these things given the importance of CEDA to our customers. The code base was complex, minimally documented, and development relied on remembering a long list of “gotchas” stored in the developer’s brain. It showed all of the signs of a research project that needed more maturity to support the speed and scale our customers demanded.
CEDA updates as software development
Through retros and collected learnings from our experiences developing CEDA, our team looked towards modernizing the development experience by introducing software engineering practices to the codebase. This consisted of a number of piecemeal initiatives throughout the year:
- To minimize cognitive load during development, we introduced types, schemas, and interfaces and cleaned up tech debt.
- To improve knowledge sharing and collaboration, we added unit tests, aligned on shared data models, and improved our code review standards.
- To increase our confidence in the codebase, we added regression tests, alerting, and versioning utilities for data assets.
This work was a great opportunity for the climate scientists and software engineers on our team to collaborate and share expertise. Engineers shared tips on best software development practices, while climate scientists advised on the right data models and interfaces the data pipeline needs.
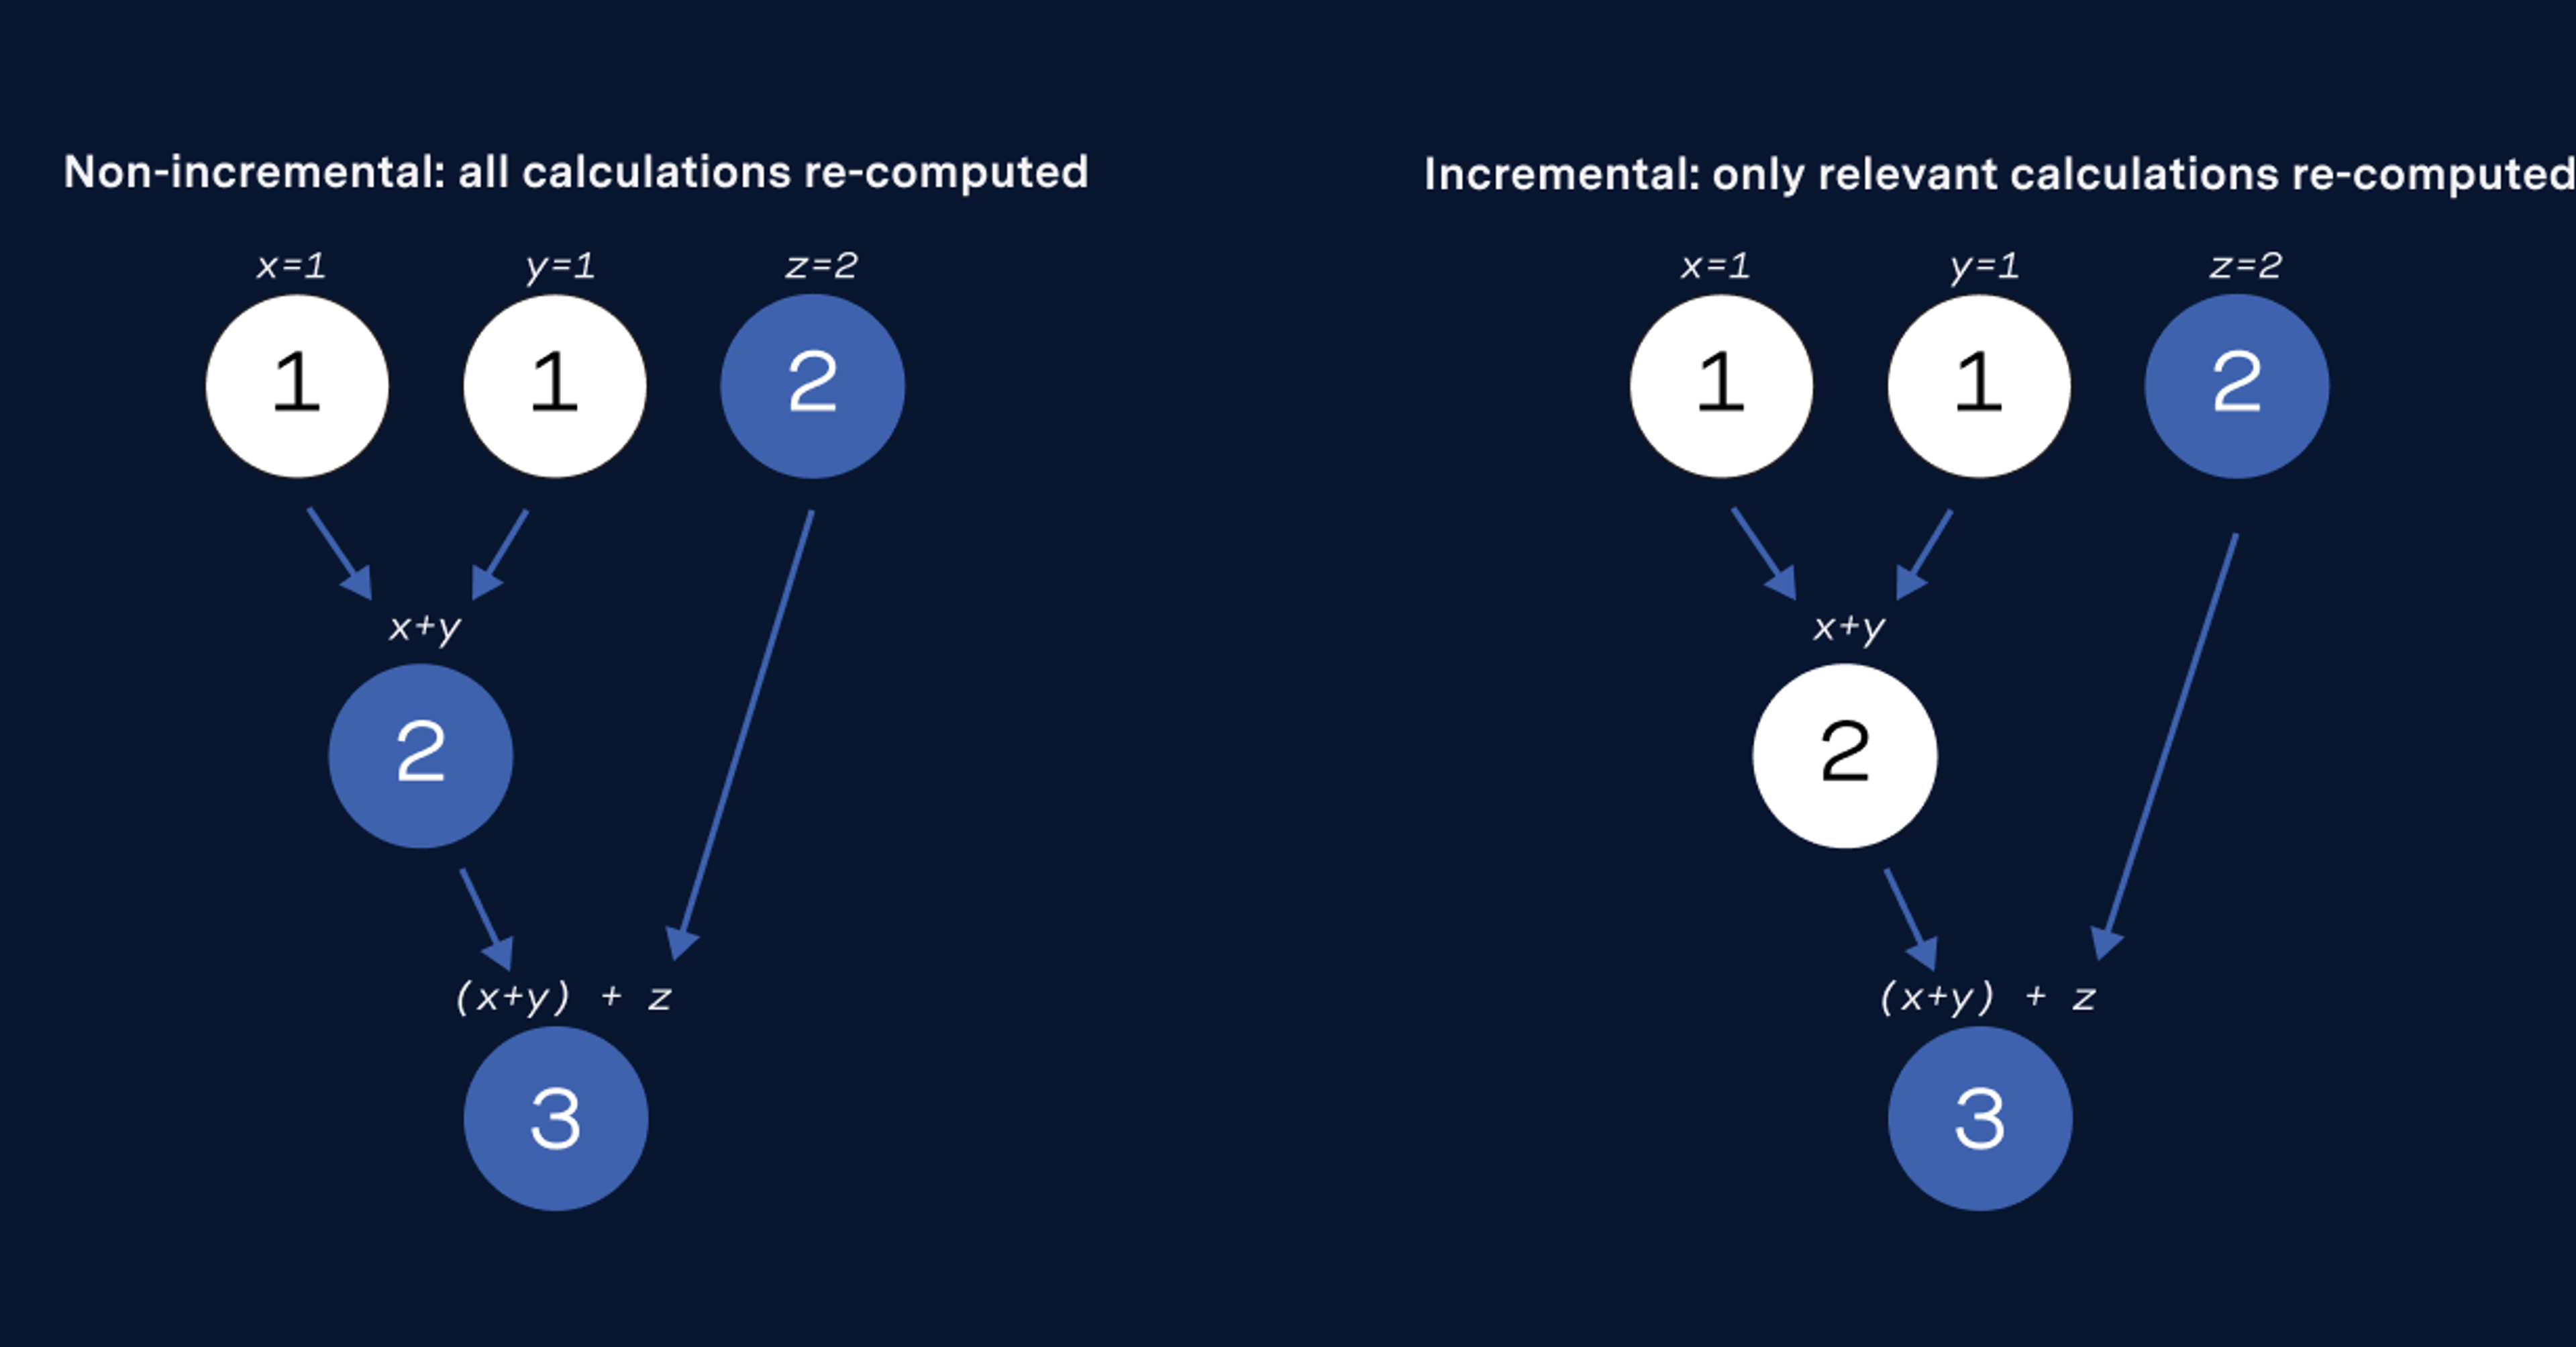
One big learning that came from this cross-discipline collaboration was the need for the CEDA codebase to enable not just fast software engineering, but fast scientific exploration. In a typical software application, tooling and workflows focus solely on the code logic, or the “plumbing” of the system. But typical of a data application, CEDA also cares about the data that flows through these “pipes”. Most often, a logic change to CEDA can’t be deemed good or bad unless we look at the impact its had on the final emissions factors. Even if the logic was implemented correctly (and validated through unit tests, typing, etc.), it’s possible its interaction with the input data powering CEDA renders the change undesirable.
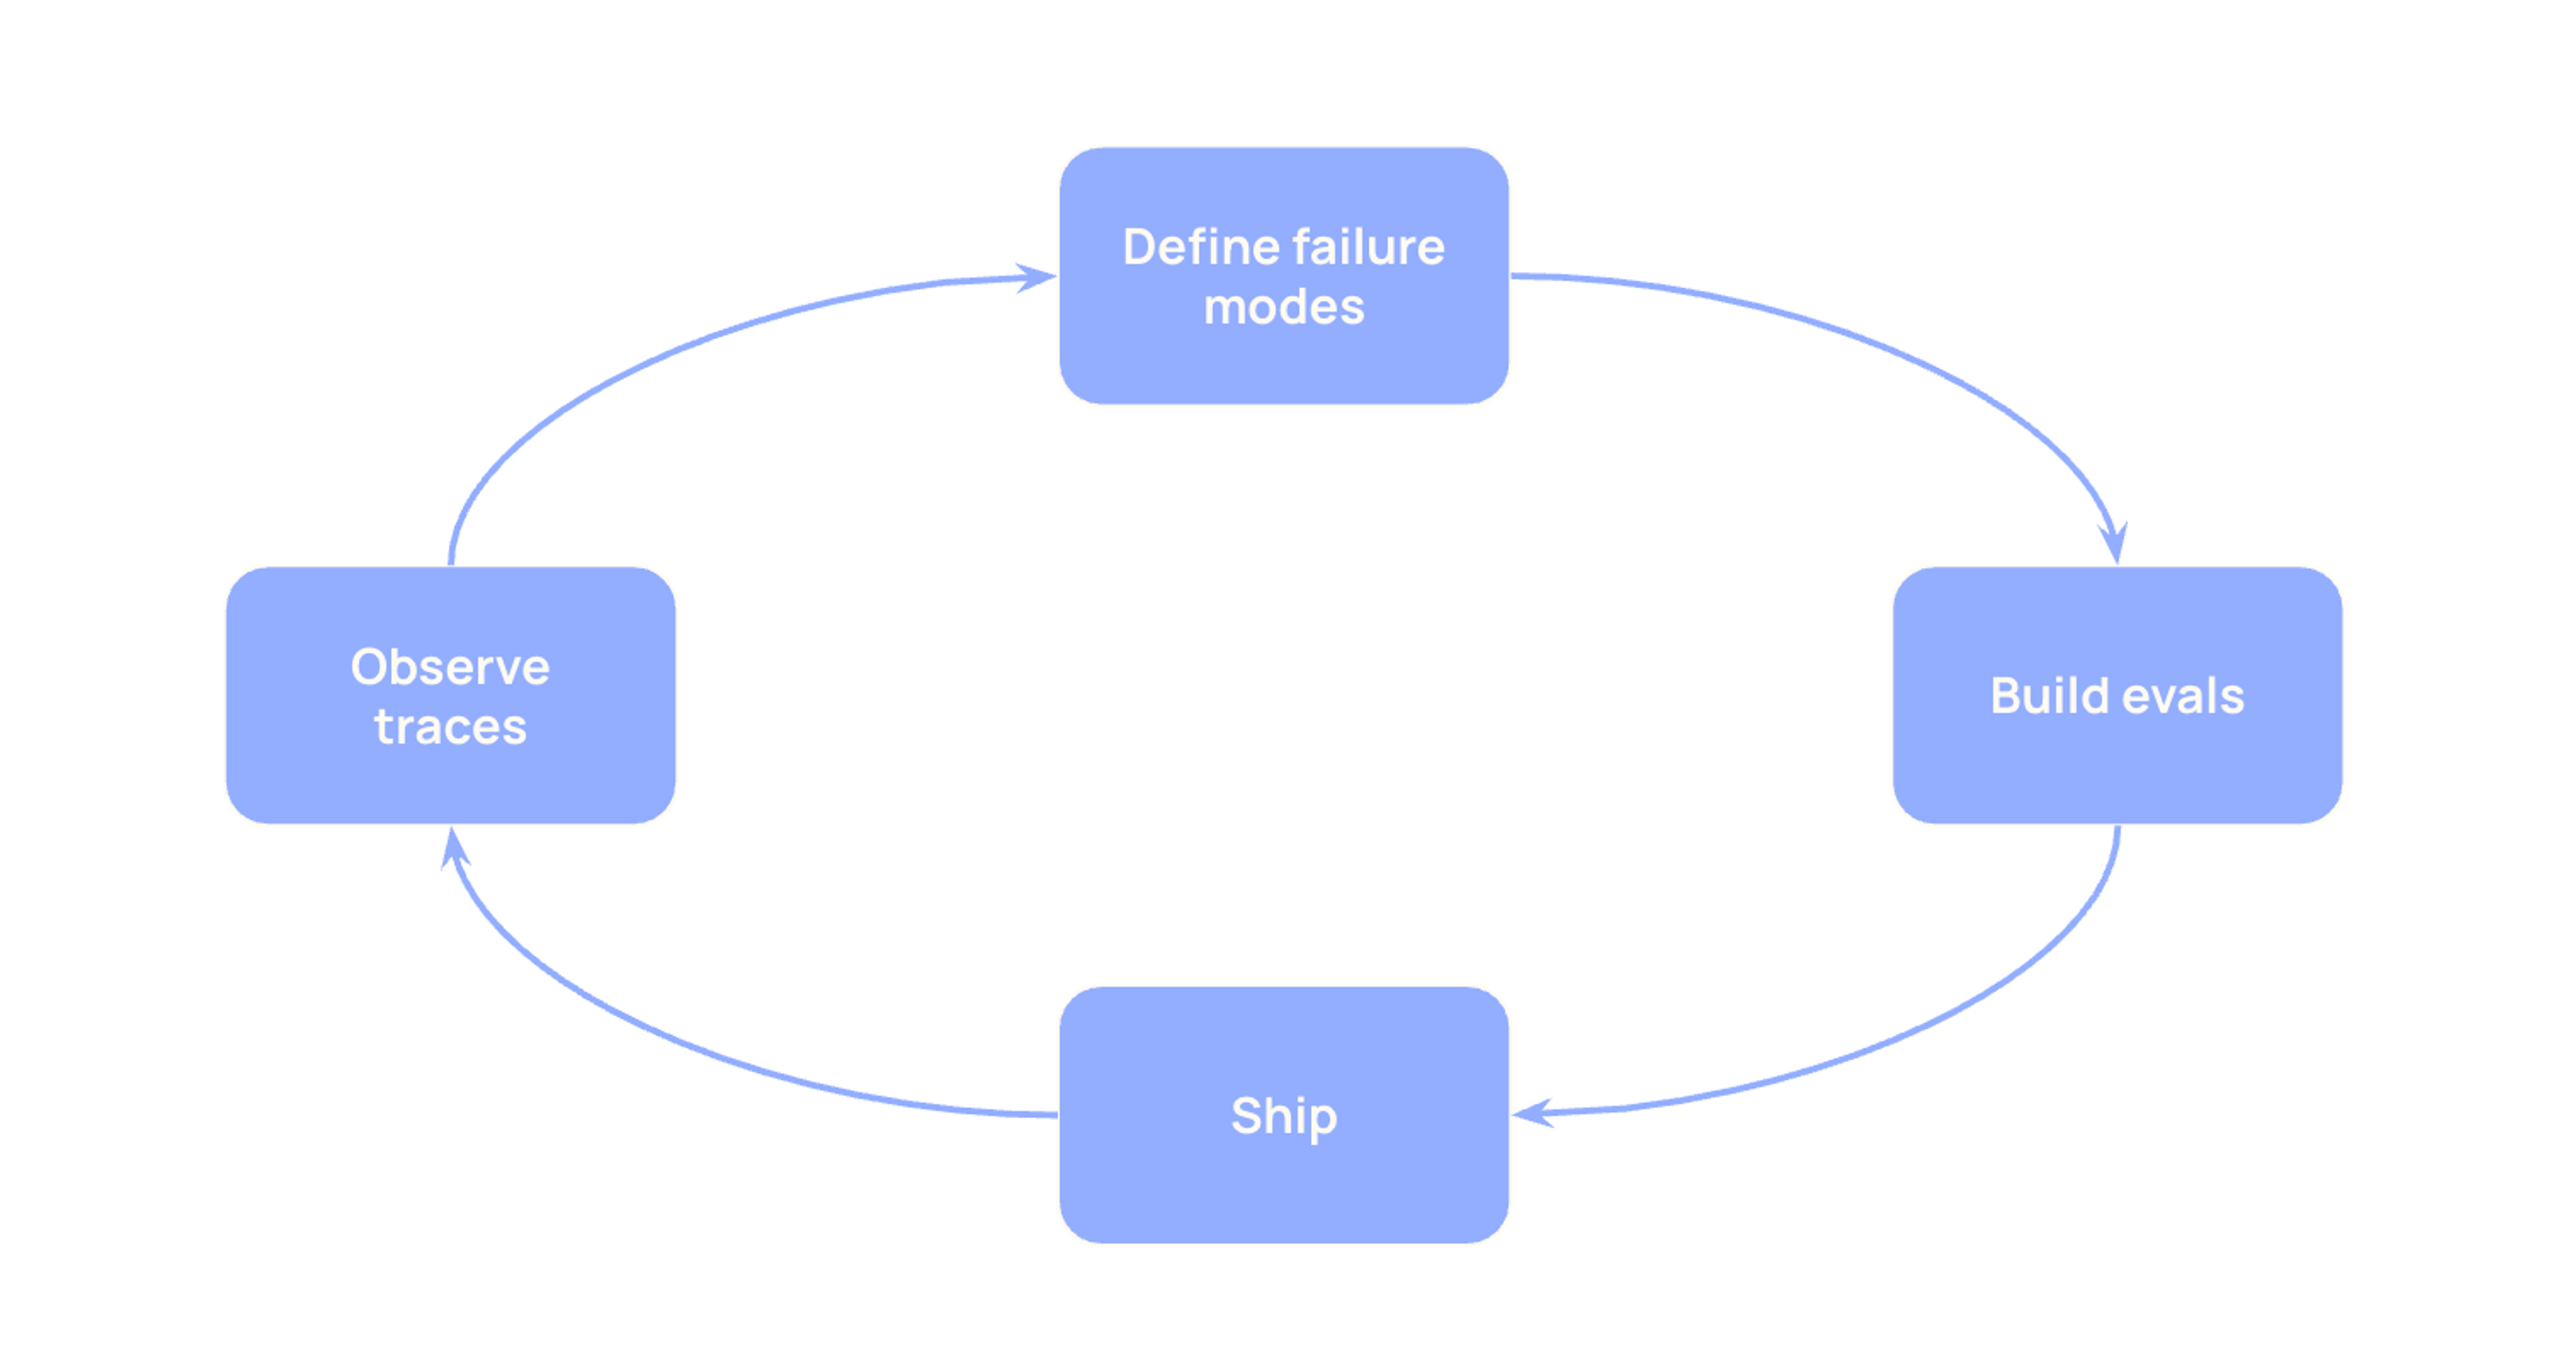
As we invested in more codebase refactors and improvements, we realized that speeding up CEDA’s scientific iteration loop is just as important as speeding up code writing. In addition to our coding infrastructure, we added new tools for easy experimentation and analysis of data flowing through our pipeline:
- To enable quick experiments of new algorithms, we added a feature flag system.
- To enable evaluating a change on real customer data, we added a staging environment that tests new emissions factors on customer footprints using Watershed’s calculation engine.
- To enable benchmarking outputs against existing literature, we added AI agents that do web search and automate our literature review process.
These purpose-built tools allow our team to iterate more quickly on experiments while also gaining more visibility into the root sources of change in a complex data pipeline.
Impact
In October of this year, we released the 2025 CEDA update under the Cornerstone Sustainability Data Initiative. Our technical investments paid off in the speed and confidence of our update. By treating data like software, we made CEDA updates faster, less error-prone, and more explainable:
- Update cycle time: reduced from 6 to 3 person-months
- Database change management and validation: cut from 1 month to 1 week
- A strong foundation for future updates
Looking ahead
The CEDA team’s current focus is contributing to the Cornerstone initiative’s 2026 Cornerstone model release, which will merge CEDA and USEEIO into a single, unified economic environmental model. This model will serve the 65% of CDP-reported Scope 3 emissions that currently use these two databases. We are excited to build upon the software infrastructure and workflows we’ve already built to enable more data-backed climate action.
If you’re an engineer who cares about climate and wants to work on systems that make real-world impact, join us!